Day 2 Ops / README
Install a Prometheus instance to monitor an Open Liberty application on OCP 4.3
We will use the Prometheus Operator provided by OCP to install and configure Prometheus into a new namespace (project). We will then install a test application using the Open Liberty Operator. The application will provide a metrics endpoint for Prometheus to gather statistics.
1. Test app
Use a simple Microprofile metrics demo application from Open Liberty guides https://openliberty.io/guides/microprofile-metrics.html
This app is used ‘as is’ (although we disabled the default security for now to make it simpler to play with). You can pull the docker image from the hub to run it locally.
docker run -p 9080:9080 yarod/microprofile-monitoring
2. Install and configure Prometheus
OCP provides a monitoring stack (Prometheus + Grafana) but up to now has not allowed it to be used for user workload monitoring.
As there is a Liberty monitoring dashboard for Grafana designed to visualize Liberty-specific Microprofile metrics, we will use our own instance of Prometheus to gather the metrics and as a target for a new Grafana instance to display the Liberty dashboard.
2.1 Create the required Service IDs, ClusterRoles, and ClusterRoleBindings
This scenario generally follows Kabanero documentation and installs a separate Prometheus instance.
2.1.1 Create a new Project/Namespace
To facilitate security and isolation we want to run Prometheus in its own namespace. To achieve this we create a new project/namespace for it. For our example we will call it “prometheus-test”. You must be logged into the OCP system and able to use the Openshift CLI (oc) commands to complete this exercise. We use the “test” suffix throughout our examples but in production you would likely use some other suffix that identifies your applications.
oc new-project prometheus-test
2.1.2 Service Accounts
Both the Prometheus Operator and Prometheus itself must have an identity (account) when they are run. Each of these programs requires specific authorizations in order to function. In a Role Based Authentication System (RBAC) like OpenShift these accounts are called Service Accounts. Roles with cluster wide access are called ClusterRoles. To connect an account with a clusterrole you use a ClusterRoleBinding. Note that you will require admin authority on the cluster to create, alter, or delete cluster roles and bindings.
The service account for the Prometheus Operator is named prometheus-operator. To create it copy the file PromOperServiceAccount.yaml and issue the command:
oc apply -f PromOperServiceAccount.yaml
Do the same for the next two:
The service acccount for Prometheus itself:
oc apply -f PrometheusServiceAccount.yaml
Add the 2nd service account that Prometheus expects:
oc apply -f k8sServiceAccount.yaml
confirm via:
oc get serviceaccount
and you should see the three new service accounts (along with those kubernetes creates for each namespace):
NAME SECRETS AGEbuilder 2 7m49sdefault 2 7m49sdeployer 2 7m49sprometheus 2 115sprometheus-k8s 2 4sprometheus-operator 2 3m30s
2.1.3 Create the Cluster Roles
As we are running on an OpenShift system there are cluster roles already for those service IDs. However, those cluster roles were defined for the openshift-monitoring namespace. They may not match those we need for our instance of prometheus. Additionally, any changes to those cluster roles by cluster administrators can potentially have unknown consequences for our instance.
Therefore, we will create our own versions of the cluster roles (note: if you wish to reuse the existing cluster roles you must still create our prometheus-k8s-test cluster role if you want Prometheus to monitor an application outside its own namespace as the default prometheus-k8s cluster role does not have that ability).
You are free to replace the test suffix with something more meaningful but then you must edit the cluster role bindings yaml files to pick up the new object names.
prometheus-operator-test cluster role:
oc apply -f promoprole.yaml
prometheus-test cluster role:
oc apply -f promrole.yaml
prometheus-k8s-test cluster role:
oc apply -f prometheus-k8s-custom.yaml
Note that the prometheus-k8s-test cluster role is a merge of the default OCP permissions for the prometheus-k8s account and those recommended by the Prometheus Operator documentation.
Before granting users access to the Prometheus namespace it is recommended that you review and understand the permissions for all three service IDs.
Now you can confirm the ClusterRoles you have created via:
oc get clusterrole
This will display all the ClusterRoles for the system. Or confirm them individually:
oc get clusterrole/prometheus-testoc get clusterrole/prometheus-operator-testoc get clusterrole/prometheus-k8s-test
To view the contents of an individual clusterrole:
oc describe clusterrole/prometheus-test
example output:
Name: prometheus-testLabels: <none>Annotations: kubectl.kubernetes.io/last-applied-configuration:{"apiVersion":"rbac.authorization.k8s.io/v1beta1","kind":"ClusterRole","metadata":{"annotations":{},"name":"prometheus-test"},"rules":[{"a...PolicyRule:Resources Non-Resource URLs Resource Names Verbs--------- ----------------- -------------- -----endpoints [] [] [get list watch]nodes [] [] [get list watch]
2.1.4 Bind the Service Accounts to their Cluster Roles
This is done via a ClusterRoleBinding.
prometheus:
oc apply -f prombinding.yaml
prometheus-operator:
oc apply -f promopbinding.yaml
prometheus-k8s:
oc apply -f customrolebindingK8s.yaml
These are based on information in the Github site for the Prometheus Operator. You can refer to it at: https://github.com/coreos/prometheus-operator/
2.2 Create a Prometheus instance
2.2.1 Install the Prometheus Operator
From the IBM Cloud Dashboard select the project (in our example: prometheus-test). Then open the Operators section and click on Installed Operators:
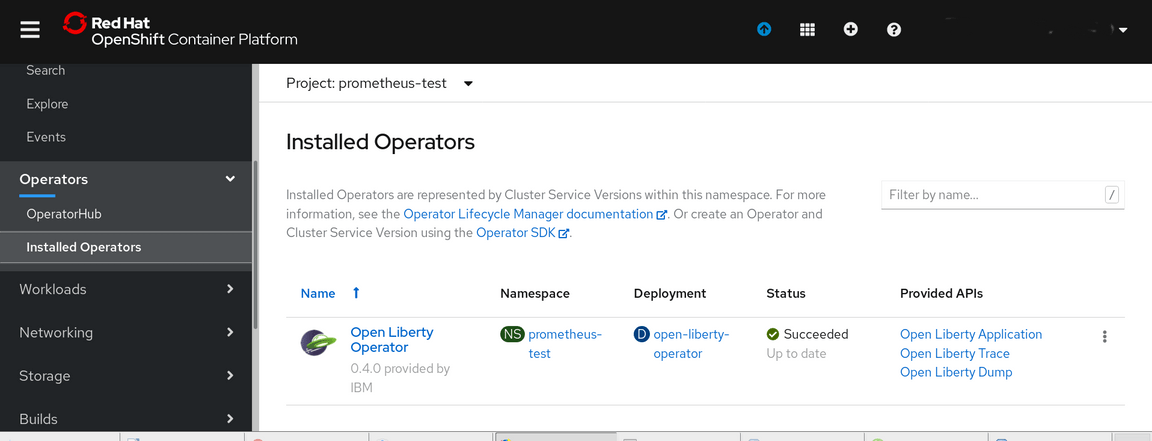
Our system has only the Open Liberty Operator installed so we must add the Prometheus Operator to it.
Select the OperatorHub option:
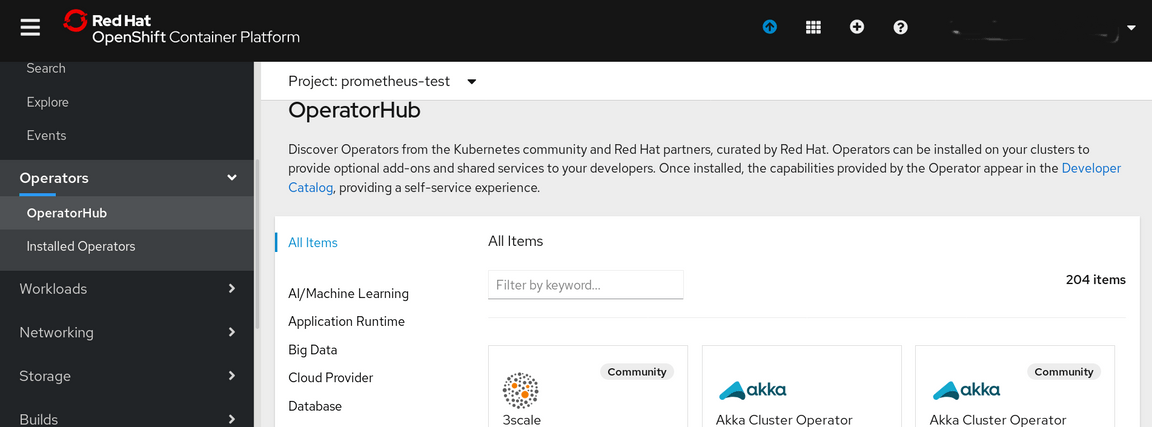
Put the name prometheus into the Filter by keyword area:
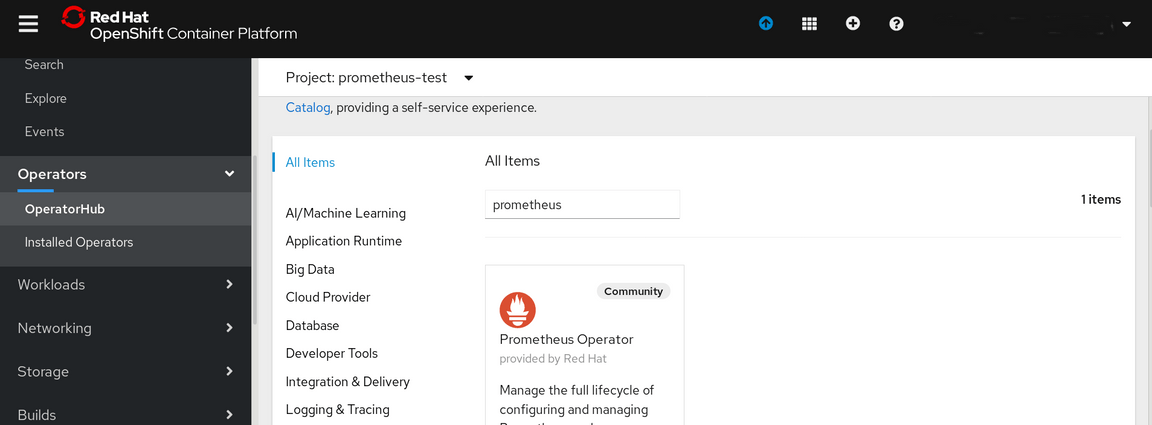
Click on the Prometheus Operator and answer Continue to the warning screen. This will bring up the Install option:
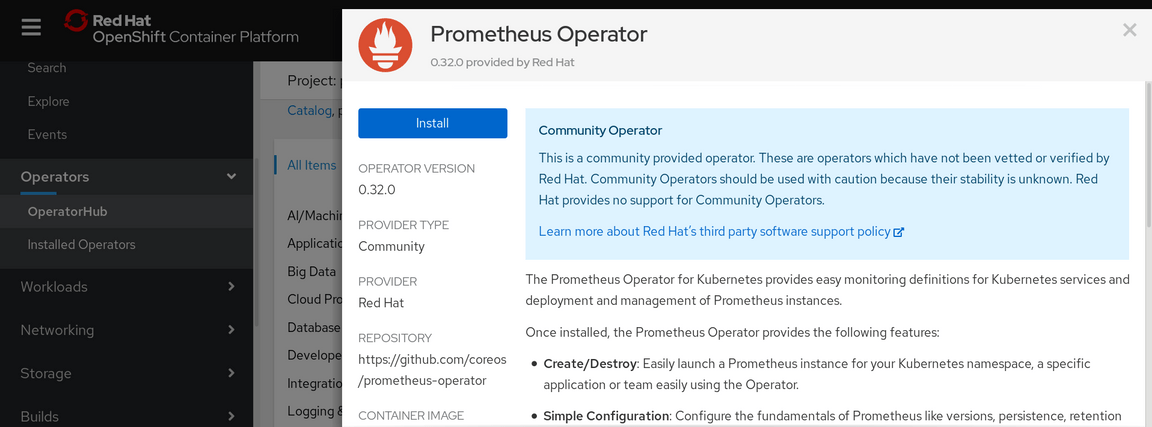
This is the Prometheus Operator Subscription Screen.
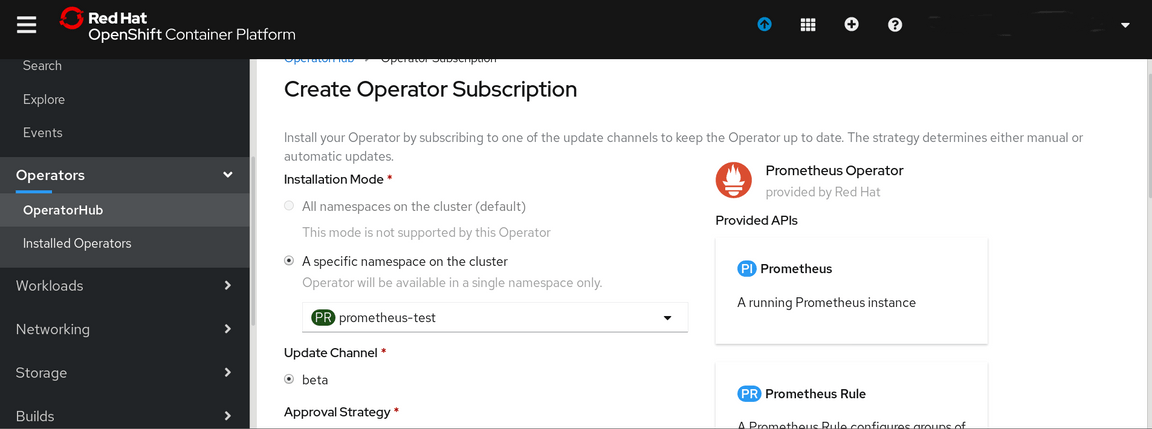
Click on Subscribe at the bottom on the screen.
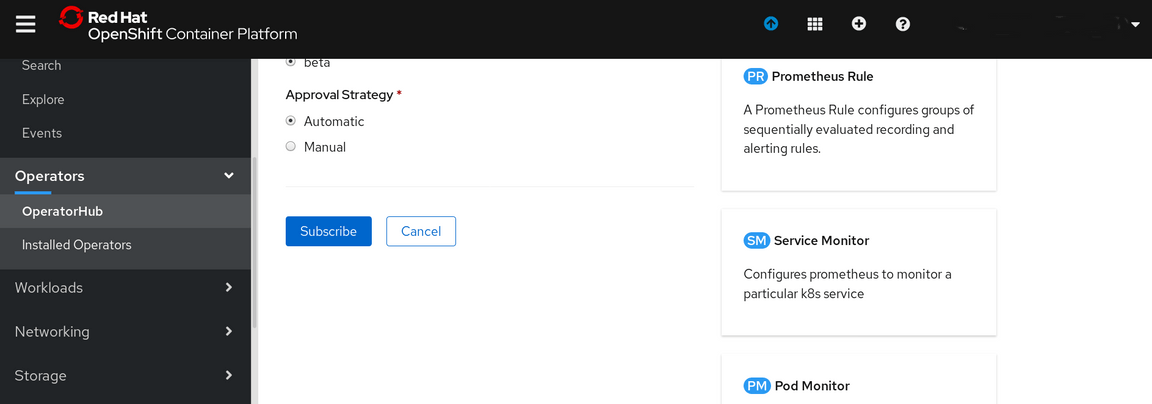
Now examine the Installed Operators and you will see that you now have the Prometheus Operator available:
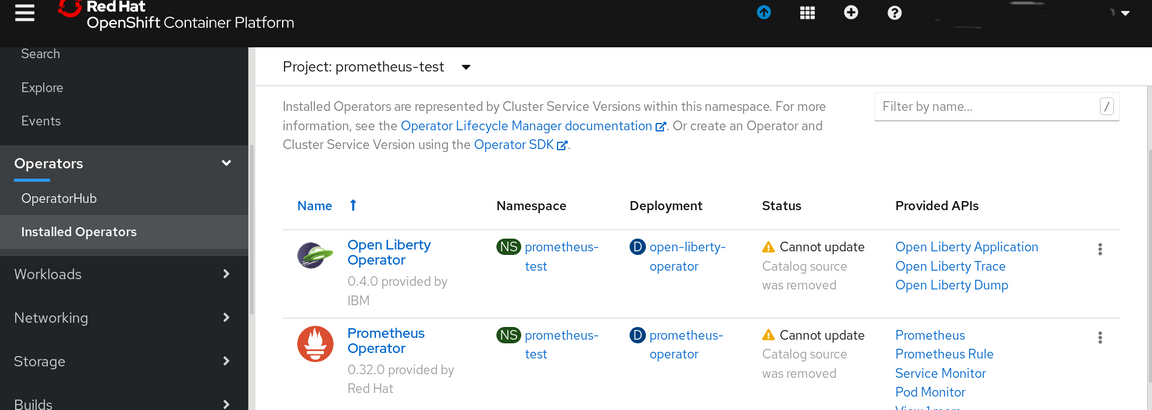
2.2.2 Install & Configure a Prometheus Instance
From the Installed Operators click on the Prometheus Operator

This will bring up the Prometheus Operator screen. Click on Create Instance

and you will see the Create selection

Copy the contents of the PromConfigNames.yaml file into the selection area of the screen and click on Create. This will instantiate prometheus in your namespace (this yaml will need to be customized for a production installation, for example to control storage usage, you can find the options at https://github.com/coreos/prometheus-operator/blob/master/Documentation/api.md).
Verify the Prometheus Service is running:
oc get svc -n prometheus-test
NAME TYPE CLUSTER-IP EXTERNAL-IP PORT(S) AGEprometheus-operated ClusterIP None <none> 9090/TCP 4m54s
Expose the prometheus-operated service externally:
oc expose svc/prometheus-operated -n prometheus-test
13. Confirm the external route:
oc get routes -n prometheus-test
route.route.openshift.io/prometheus-operated exposed
Now go to your project dashboard page and scroll down to the Deployments area.

Click on the Route option
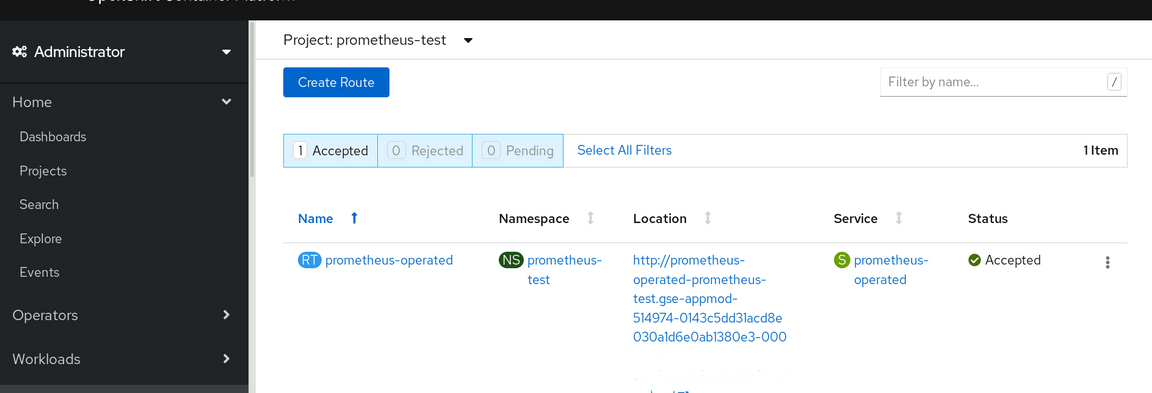
Now click on the URL under the Location header to open a new window for the Prometheus console
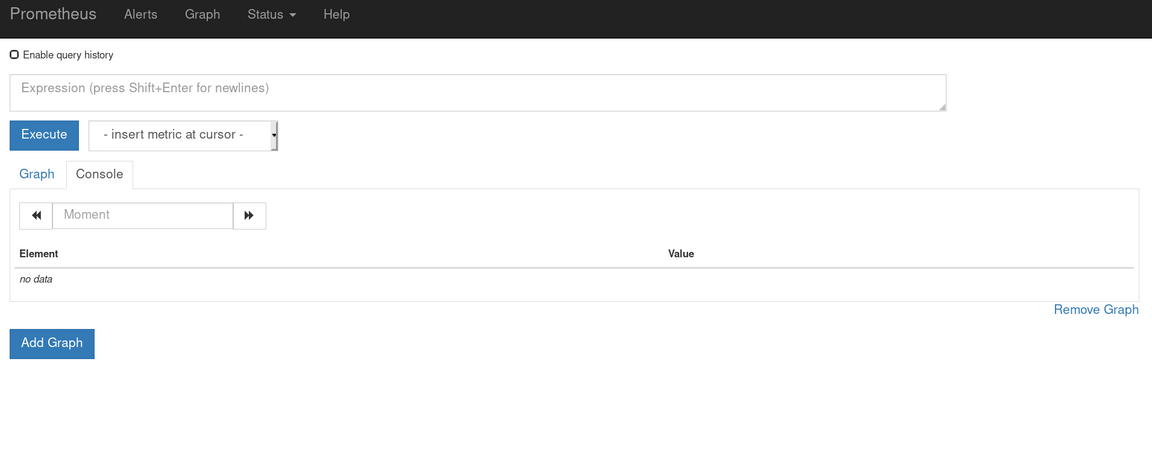
Prometheus has been installed and is running although as yet it hasn’t found any applications to monitor.
3 Deploy an app via the Open Liberty Operator
So far we have not created any monitoring targets for Prometheus. Note that the Prometheus we installed earlier is managed by the Prometheus operator, and the latter will monitor for ServiceMonitor CRD instances to identify monitoring targets.
3.1 Create a new project for the test application
Create a new project to hold your application. Note that we are now working in the dev-test namespace.
oc new-project dev-test
3.2 Install the Open Liberty Operator
Install the Open Liberty operator from the Operator Hub or Installed Operators as you did for the Prometheus Operator.
The documentation for the Open Liberty Operator can be found at:

Should you need to debug the Open Liberty operator deployment, you can watch the operator logs that show the deployment activity.
oc get pods -A |grep liberty
The response will look like:
openshift-operators open-liberty-operator-847d9d76c4-gt24z 1/1
Then take the name of the open-liberty-operator pod from the openshift-operators namespace and plug it into the logs command:
oc logs open-liberty-operator-847d9d76c4-gt24z -f -n openshift-operators
Note: the response is not shown here because it is extensive. (ctl-c to end the output in a linux terminal)
3.3 Create an Open Liberty Application
Once available the Installed Operators option in your project will show it.

Select the Open Liberty Operator to open it

In the Open Liberty Application area select Create Instance

Now copy the contents of the openl.yaml file into the screen for the new application and click on Create
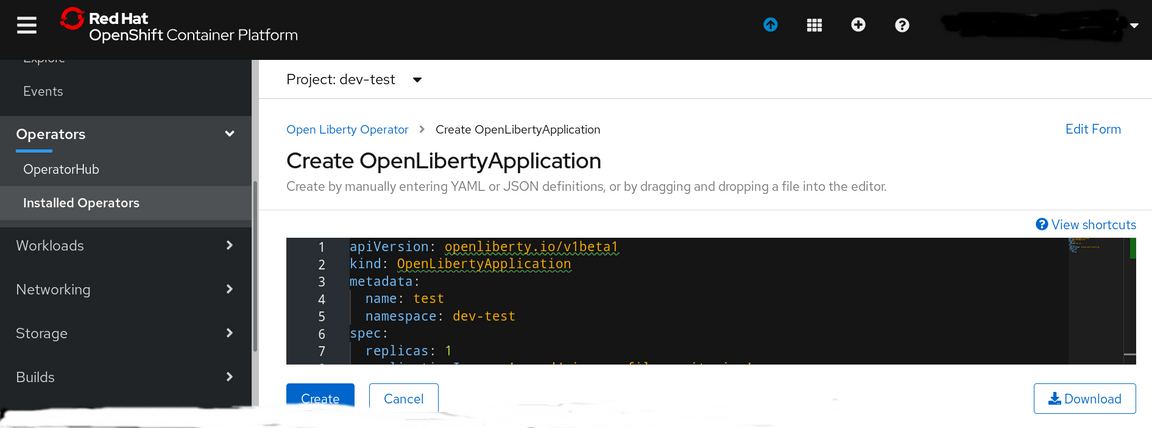
Now go back to the dev-test project dashboard and scroll down to the deployments selection to view your deployed application
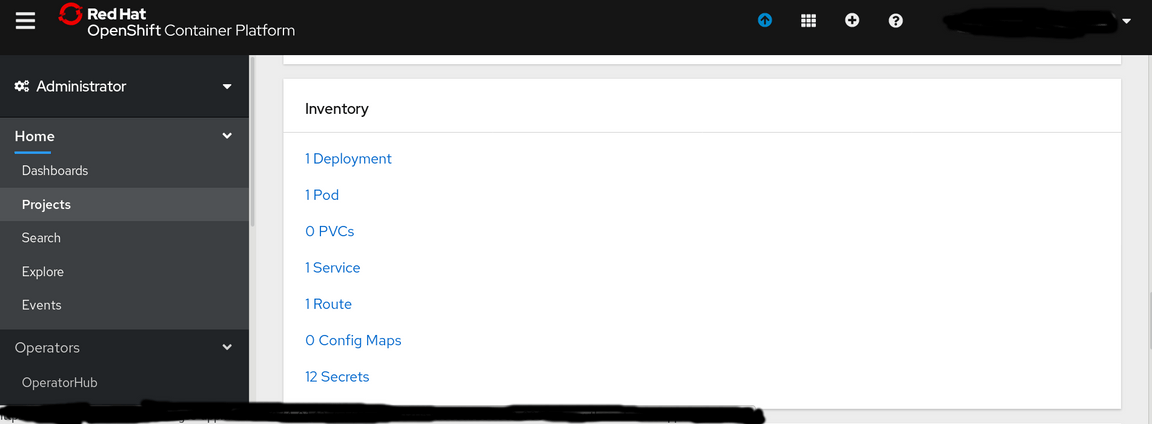
The Route will point to the application
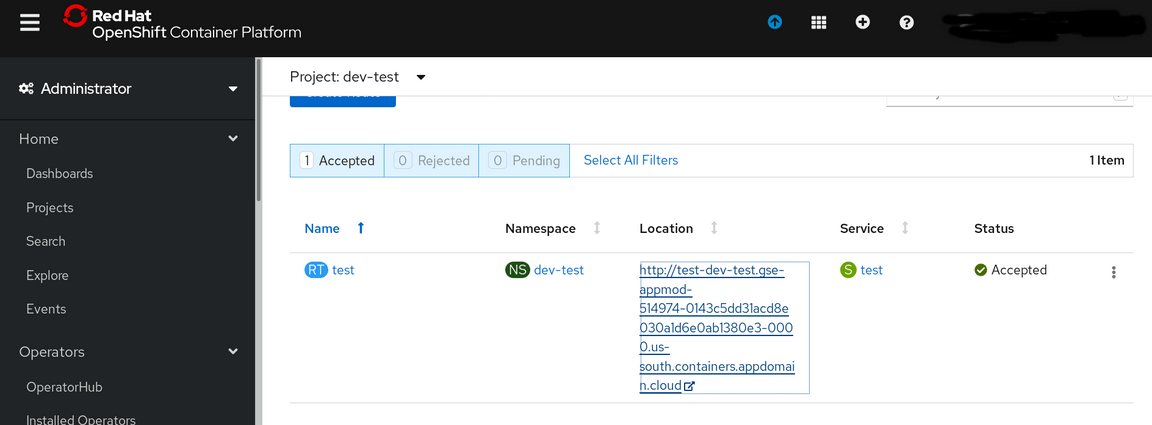
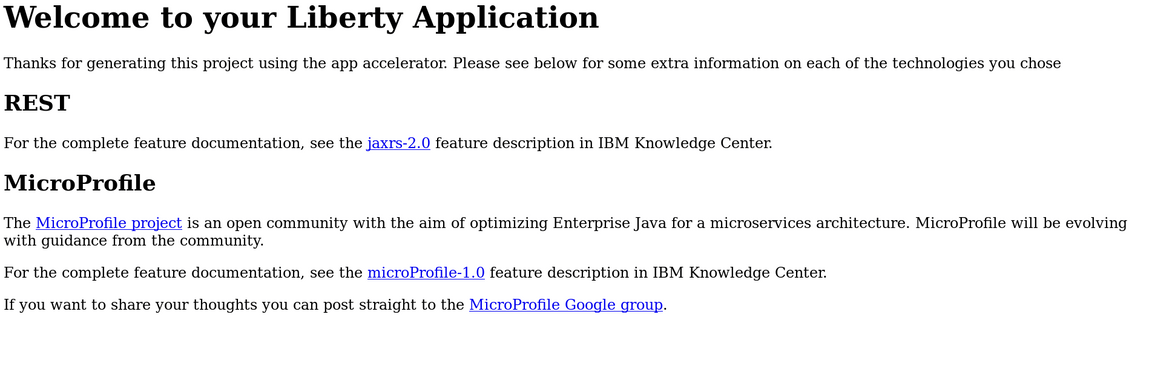
Click on the URL to view the application
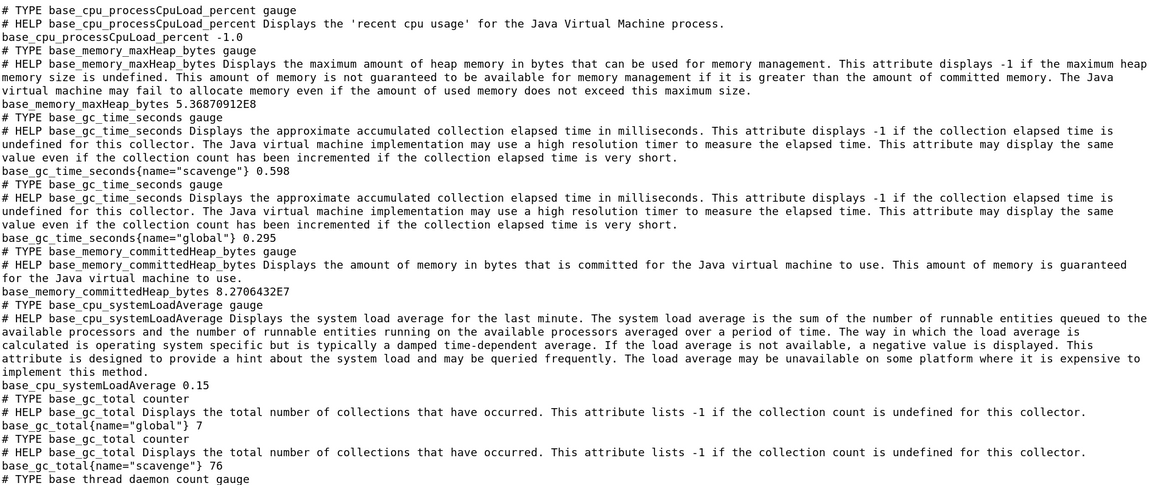
If you append /metrics to the URL in your browser you will see the metrics that the application provides for Monitoring
3.4 Create a ServiceMonitor so Prometheus can find the application
Although the Open Liberty Operator has created a ServiceMonitor object in the dev-test namespace; Prometheus (in this implementation) requires it to be in its own namespace. So we must create it.
Switch back to the prometheus-test project and go to the Installed Operators again and select the Prometheus Operator. Scroll down to find the Service Monitor section.
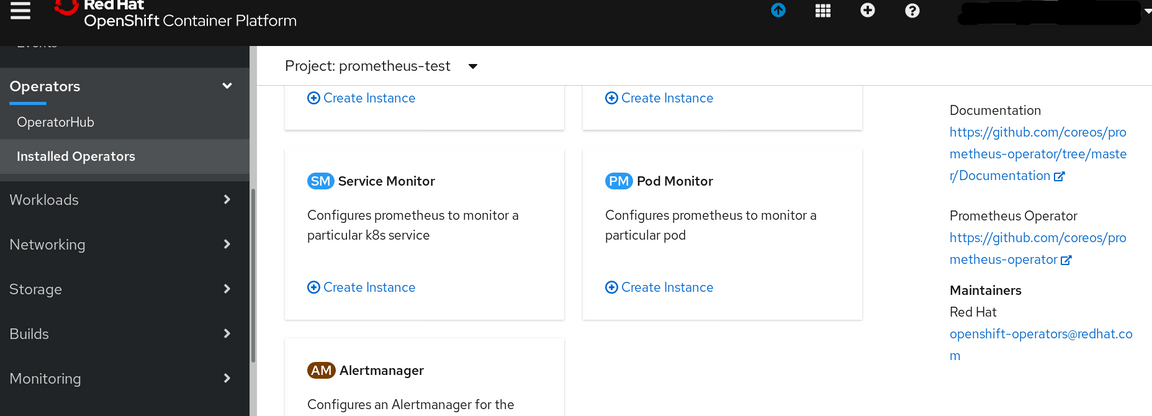
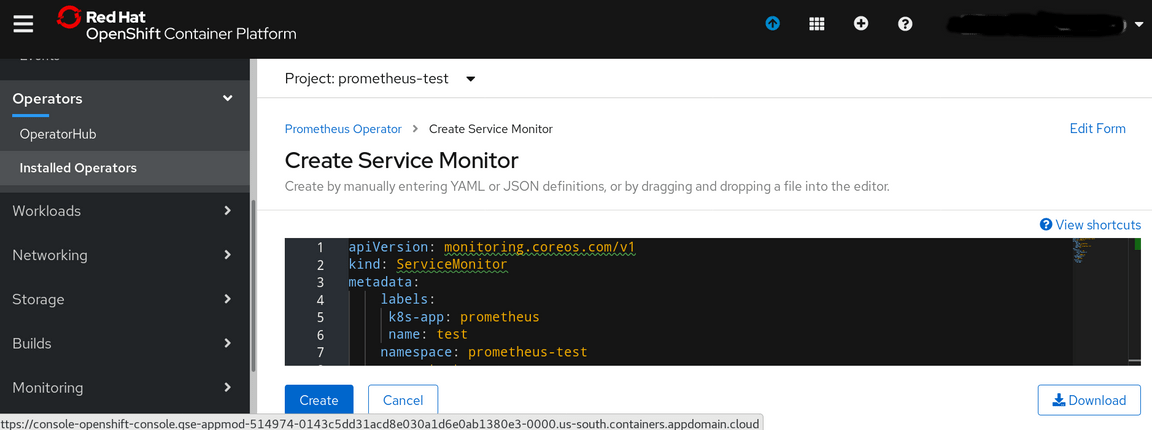
Click on Create Instance and copy/paste the contents of the servicemonitor-test.yaml file into the create Screen then click on Create to generate the ServiceMonitor object
You can view the installed servicemonitors from the Prometheus Operator screens or via oc commands
oc project prometheus-test
oc get servicemonitor
returns
NAME AGEtest 28s
oc describe servicemonitor/test
returns the contents of our new test ServiceMonitor
Name: testNamespace: prometheus-testLabels: k8s-app=prometheusname=testAnnotations: <none>API Version: monitoring.coreos.com/v1Kind: ServiceMonitorMetadata:Creation Timestamp: 2020-04-08T00:15:06Z
4 Use Prometheus to view the application Metrics
Our Prometheus instance should now be able to find our application via the test servicemonitor and it will begin to scrape the metrics every 30 seconds as we specified.
Return to the Route section of the prometheus-test dashboard
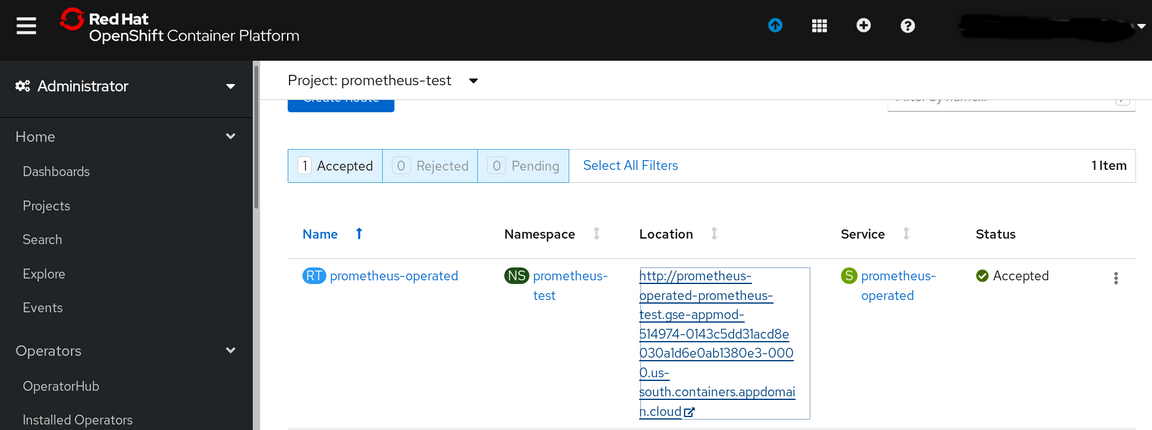
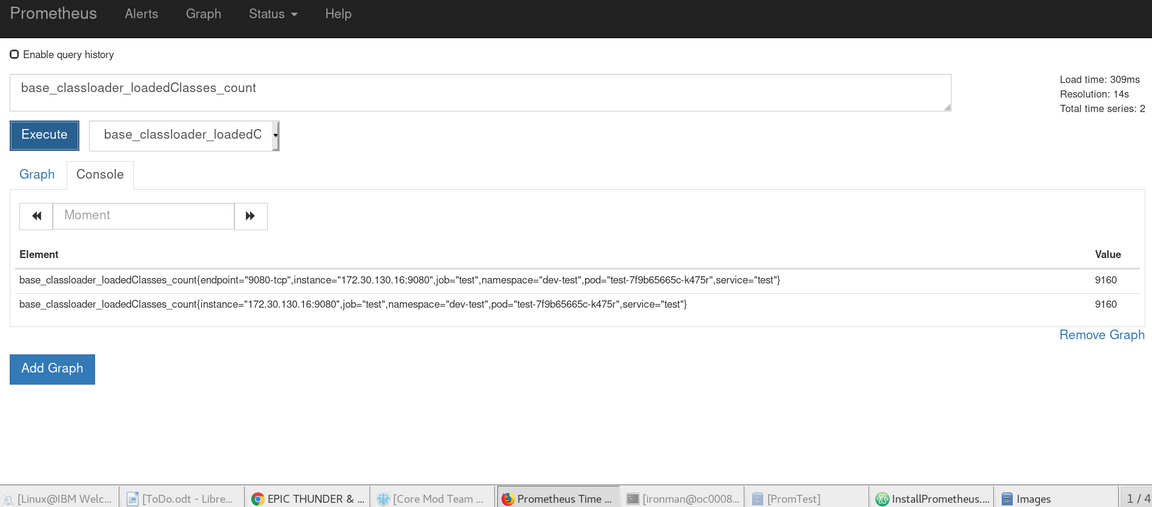
Click on the URL to return to the Prometheus console. Select the drop down in the -insert metric at cursor - box, click on any metric and then click on the Execute box. This will display that metric
Now select the Status drop down from the header bar and click on Targets

You can see Prometheus is monitoring our application.