3. Node.js monitoring instrumentation
What to instrument - the RED method
One of the most important decisions to make when setting up web application monitoring is deciding on the type of metrics you need to collect about your app. The metrics you choose simplifies troubleshooting when a problem occurs and also enables you to stay on top of the stability of your services and infrastructure.
The RED method follows on the principles outlined in the Four Golden Signals developed by Site Reliability Engineers, which focuses on measuring things that end-users care about when using your web services. With the RED method, three key metrics are instrumented that monitor every microservice in your architecture:
- (Request) Rate - the number of requests, per second, your services are serving.
- (Request) Errors - the number of failed requests per second.
- (Request) Duration - The amount of time each request takes expressed as a time interval.
Rate, Errors and Duration attempt to cover the most obvious web service issues. These metrics also capture an error rate that is expressed as a proportion of request rate.
Instrument application code with Node.js client library for Prometheus
Go to the directory where the server.js file is located and run the following command to install and configure a prom-client - a Node.js client library for Prometheus.
cd ~/b2m-nodejs/src
npm install --save prom-client
this should add the following dependency to the package.json:
"prom-client": "^11.2.1"
Enable default metrics
There are some default metrics recommended by Prometheus
itself.
To collect these, call collectDefaultMetrics
NOTE: Some of the metrics, concerning File Descriptors and Memory, are only available on Linux.
In addition, some Node-specific metrics are included, such as event loop lag, active handles and Node.js version. See what metrics there are in https://github.com/siimon/prom-client/lib/metrics.
collectDefaultMetrics takes 1 options object with 3 entries, a timeout for how
often the probe should be fired, an optional prefix for metric names
and a registry to which metrics should be registered. By default probes are
launched every 10 seconds, but this can be modified like this:
const client = require('prom-client');
const collectDefaultMetrics = client.collectDefaultMetrics;
// Probe every 5th second.
collectDefaultMetrics({ timeout: 5000 });
Lab Instructions:
Edit server.js and uncomment the following lines to enable exposure of default set of Node.js metrics on standard Prometheus route /metrics
const Prometheus = require('prom-client')
const metricsInterval = Prometheus.collectDefaultMetrics()
and
 app.get('/metrics', (req, res) => {
   res.set('Content-Type', Prometheus.register.contentType)
   res.end(Prometheus.register.metrics())
 })
Test the application locally:
cd ~/b2m-nodejs/src
npm start server.js
Run a couple of transactions by refreshing the URL: http://localhost:3001/checkout
Use browser or curl to access http://localhost:3001/metrics to verify exposed metrics. Output should be similar to:
# HELP process_cpu_user_seconds_total Total user CPU time spent in seconds.
# TYPE process_cpu_user_seconds_total counter
process_cpu_user_seconds_total 0.028084 1546452963611

# HELP process_cpu_system_seconds_total Total system CPU time spent in seconds.
# TYPE process_cpu_system_seconds_total counter
process_cpu_system_seconds_total 0.0038780000000000004 1546452963611

# HELP process_cpu_seconds_total Total user and system CPU time spent in seconds.
# TYPE process_cpu_seconds_total counter
process_cpu_seconds_total 0.031962 1546452963611

# HELP process_start_time_seconds Start time of the process since unix epoch in seconds.
# TYPE process_start_time_seconds gauge
process_start_time_seconds 1546452953

# HELP process_resident_memory_bytes Resident memory size in bytes.
# TYPE process_resident_memory_bytes gauge
process_resident_memory_bytes 29188096 1546452963611

# HELP nodejs_eventloop_lag_seconds Lag of event loop in seconds.
# TYPE nodejs_eventloop_lag_seconds gauge
nodejs_eventloop_lag_seconds 0.000393303 1546452963612

# HELP nodejs_active_handles_total Number of active handles.
# TYPE nodejs_active_handles_total gauge
nodejs_active_handles_total 3 1546452963611

# HELP nodejs_active_requests_total Number of active requests.
# TYPE nodejs_active_requests_total gauge
nodejs_active_requests_total 0 1546452963611

# HELP nodejs_heap_size_total_bytes Process heap size from node.js in bytes.
# TYPE nodejs_heap_size_total_bytes gauge
nodejs_heap_size_total_bytes 20217856 1546452963611

# HELP nodejs_heap_size_used_bytes Process heap size used from node.js in bytes.
# TYPE nodejs_heap_size_used_bytes gauge
nodejs_heap_size_used_bytes 8464704 1546452963611

# HELP nodejs_external_memory_bytes Nodejs external memory size in bytes.
# TYPE nodejs_external_memory_bytes gauge
nodejs_external_memory_bytes 24656 1546452963611

# HELP nodejs_heap_space_size_total_bytes Process heap space size total from node.js in bytes.
# TYPE nodejs_heap_space_size_total_bytes gauge
nodejs_heap_space_size_total_bytes{space="read_only"} 0 1546452963612
nodejs_heap_space_size_total_bytes{space="new"} 8388608 1546452963612
nodejs_heap_space_size_total_bytes{space="old"} 8134656 1546452963612
nodejs_heap_space_size_total_bytes{space="code"} 1048576 1546452963612
nodejs_heap_space_size_total_bytes{space="map"} 1073152 1546452963612
nodejs_heap_space_size_total_bytes{space="large_object"} 1572864 1546452963612

# HELP nodejs_heap_space_size_used_bytes Process heap space size used from node.js in bytes.
# TYPE nodejs_heap_space_size_used_bytes gauge
nodejs_heap_space_size_used_bytes{space="read_only"} 0 1546452963612
nodejs_heap_space_size_used_bytes{space="new"} 829768 1546452963612
nodejs_heap_space_size_used_bytes{space="old"} 6008448 1546452963612
nodejs_heap_space_size_used_bytes{space="code"} 847136 1546452963612
nodejs_heap_space_size_used_bytes{space="map"} 533016 1546452963612
nodejs_heap_space_size_used_bytes{space="large_object"} 249024 1546452963612

# HELP nodejs_heap_space_size_available_bytes Process heap space size available from node.js in bytes.
# TYPE nodejs_heap_space_size_available_bytes gauge
nodejs_heap_space_size_available_bytes{space="read_only"} 0 1546452963612
nodejs_heap_space_size_available_bytes{space="new"} 3294904 1546452963612
nodejs_heap_space_size_available_bytes{space="old"} 1656536 1546452963612
nodejs_heap_space_size_available_bytes{space="code"} 0 1546452963612
nodejs_heap_space_size_available_bytes{space="map"} 80 1546452963612
nodejs_heap_space_size_available_bytes{space="large_object"} 1506500096 1546452963612

# HELP nodejs_version_info Node.js version info.
# TYPE nodejs_version_info gauge
nodejs_version_info{version="v10.7.0",major="10",minor="7",patch="0"} 1
Stop node.js app ctrl-c.
Define custom metric
Node.js Prometheus client library allows to define various types of Prometheus metrics like histograms, summaries, gauges and counters. More detailed description of metric types can be found in Prometheus documentation.
In this lab we will define two custom metrics:
- counter
checkouts_totalwhich will store a total number ofcheckoutrequests - histogram
http_request_duration_mswhich will store percentiles of application requests response time
Lab Instructions:
Uncomment the rest of commented lines in server.js.
checkouts_total
Declaration of checkouts_total counter.
const checkoutsTotal = new Prometheus.Counter({
   name: 'checkouts_total',
   help: 'Total number of checkouts',
   labelNames: ['payment_method']
 })
This counter will be incremented for every checkout request
checkoutsTotal.inc({
     payment_method: paymentMethod
})
http_request_duration_ms
Declaration of http_request_duration_ms histogram:
const httpRequestDurationMicroseconds = new Prometheus.Histogram({
   name: 'http_request_duration_ms',
   help: 'Duration of HTTP requests in ms',
   labelNames: ['method', 'route', 'code'],
   buckets: [0.10, 5, 15, 50, 100, 200, 300, 400, 500]  // buckets for response time from 0.1ms to 500ms
 })
The current time is recorded before each request:
app.use((req, res, next) => {
  res.locals.startEpoch = Date.now()
  next()
})
We record the current time also after each request and update our http_request_duration_ms histogram accordingly:
app.use((req, res, next) => {
  const responseTimeInMs = Date.now() - res.locals.startEpoch

  httpRequestDurationMicroseconds
    .labels(req.method, req.route.path, res.statusCode)
    .observe(responseTimeInMs)
  next()
})
After you complete code changes, start the local application instance:
cd ~/b2m-nodejs/src
npm start server.js
Run a couple of transactions by refreshing the URL: http://localhost:3001/checkout
Use browser to access http://localhost:3001/metrics to verify exposed metrics. Output should be similar to:
(...)
# HELP checkouts_total Total number of checkouts
# TYPE checkouts_total counter
checkouts_total{payment_method="paypal"} 7
checkouts_total{payment_method="stripe"} 5

# HELP http_request_duration_ms Duration of HTTP requests in ms
# TYPE http_request_duration_ms histogram
http_request_duration_ms_bucket{le="0.1",code="304",route="/",method="GET"} 0
http_request_duration_ms_bucket{le="5",code="304",route="/",method="GET"} 0
http_request_duration_ms_bucket{le="15",code="304",route="/",method="GET"} 0
http_request_duration_ms_bucket{le="50",code="304",route="/",method="GET"} 0
http_request_duration_ms_bucket{le="100",code="304",route="/",method="GET"} 0
http_request_duration_ms_bucket{le="200",code="304",route="/",method="GET"} 3
http_request_duration_ms_bucket{le="300",code="304",route="/",method="GET"} 3
http_request_duration_ms_bucket{le="400",code="304",route="/",method="GET"} 3
http_request_duration_ms_bucket{le="500",code="304",route="/",method="GET"} 3
http_request_duration_ms_bucket{le="+Inf",code="304",route="/",method="GET"} 3
http_request_duration_ms_sum{method="GET",route="/",code="304"} 415
http_request_duration_ms_count{method="GET",route="/",code="304"} 3
http_request_duration_ms_bucket{le="0.1",code="500",route="/bad",method="GET"} 0
http_request_duration_ms_bucket{le="5",code="500",route="/bad",method="GET"} 1
http_request_duration_ms_bucket{le="15",code="500",route="/bad",method="GET"} 1
http_request_duration_ms_bucket{le="50",code="500",route="/bad",method="GET"} 1
http_request_duration_ms_bucket{le="100",code="500",route="/bad",method="GET"} 1
http_request_duration_ms_bucket{le="200",code="500",route="/bad",method="GET"} 1
http_request_duration_ms_bucket{le="300",code="500",route="/bad",method="GET"} 1
http_request_duration_ms_bucket{le="400",code="500",route="/bad",method="GET"} 1
http_request_duration_ms_bucket{le="500",code="500",route="/bad",method="GET"} 1
http_request_duration_ms_bucket{le="+Inf",code="500",route="/bad",method="GET"} 1
http_request_duration_ms_sum{method="GET",route="/bad",code="500"} 1
http_request_duration_ms_count{method="GET",route="/bad",code="500"} 1
http_request_duration_ms_bucket{le="0.1",code="304",route="/checkout",method="GET"} 8
http_request_duration_ms_bucket{le="5",code="304",route="/checkout",method="GET"} 12
http_request_duration_ms_bucket{le="15",code="304",route="/checkout",method="GET"} 12
http_request_duration_ms_bucket{le="50",code="304",route="/checkout",method="GET"} 12
http_request_duration_ms_bucket{le="100",code="304",route="/checkout",method="GET"} 12
http_request_duration_ms_bucket{le="200",code="304",route="/checkout",method="GET"} 12
http_request_duration_ms_bucket{le="300",code="304",route="/checkout",method="GET"} 12
http_request_duration_ms_bucket{le="400",code="304",route="/checkout",method="GET"} 12
http_request_duration_ms_bucket{le="500",code="304",route="/checkout",method="GET"} 12
http_request_duration_ms_bucket{le="+Inf",code="304",route="/checkout",method="GET"} 12
http_request_duration_ms_sum{method="GET",route="/checkout",code="304"} 4
http_request_duration_ms_count{method="GET",route="/checkout",code="304"} 12
Besides the default set of metrics related to resource utilization by the application process, we can see the additional metrics:
checkouts_totalby payment_methodhttp_request_duration_ms_bucketby percentile buckets and by route
Stop the node.js application with ctrl-c.
Commit and push changes to your GitHub repository and create a pull request
Commit your changes to your GiHub repository:
cd ~/b2m-nodejs
git commit -am "I added monitoring instrumentation to my app!"
git push
Logon to your GitHub account via web browser and go to the b2m-nodejs repository.
Create a pull request to submit your changes to the source Github repository. Once a pull request is opened, you can discuss and review the potential changes with collaborators and add follow-up commits before your changes are merged into the base branch.
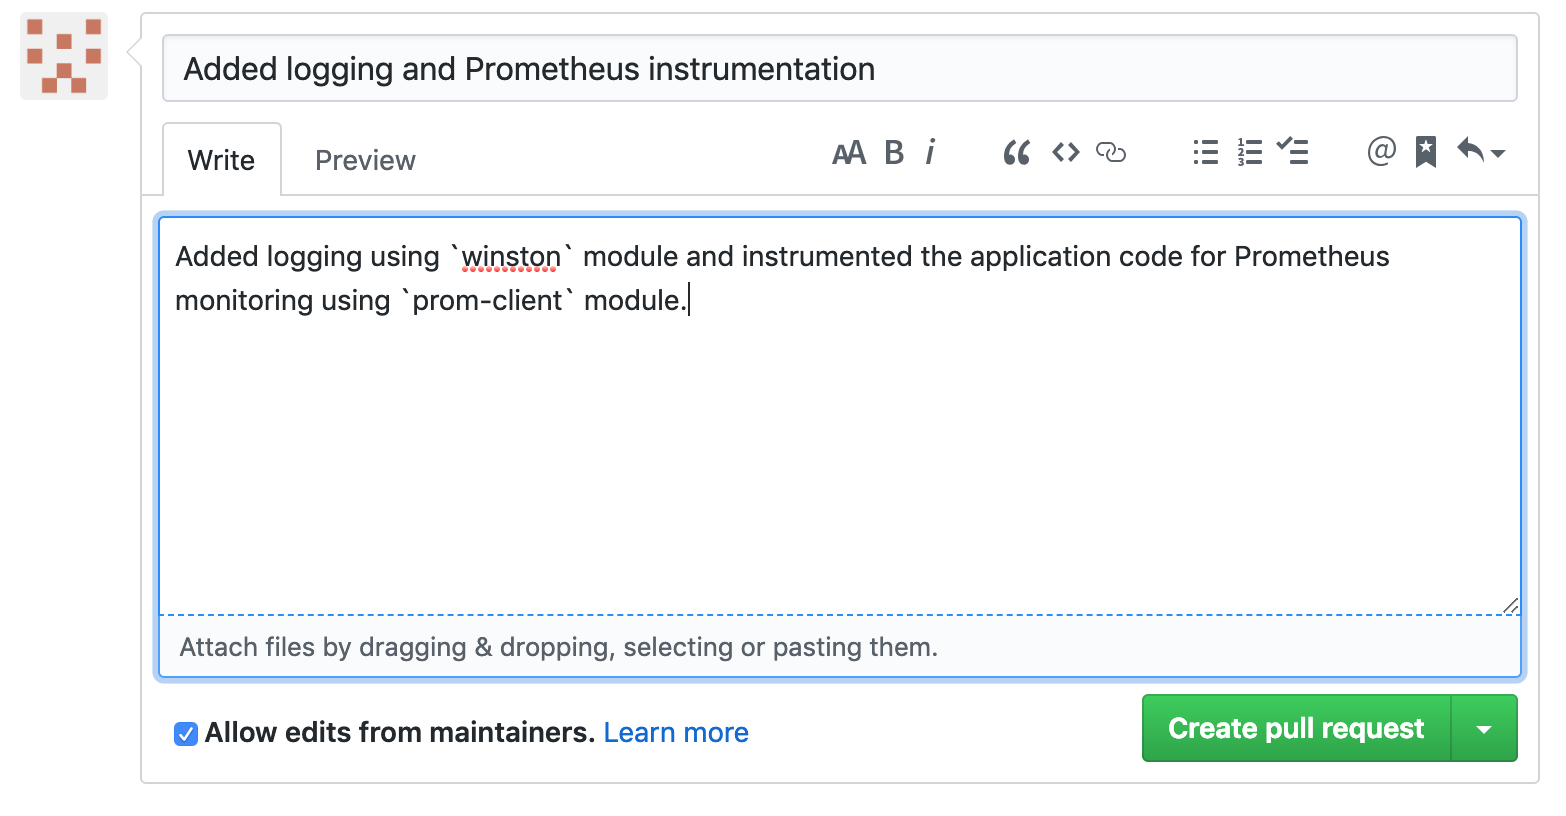
Click the New pull request button, quickly review your changes and then click Create pull request button. Write a title and description of your changes and then click Create pull request.
Build and test the Docker image
Use provided Dockerfile to rebuild the application container:
cd ~/b2m-nodejs/src
docker build -t b2m-nodejs .
Make sure the application is not running and you removed the previous application docker container:
docker ps|grep btm-nodejs
Start the updated docker container:
docker run --name btm-nodejs -d -p 3001:3001 --log-driver=gelf \
--log-opt gelf-address=udp://localhost:5000 b2m-nodejs
Verify URLs: http://localhost:3001/checkout and http://localhost:3001/metrics to make sure everything works correctly.