4. Prometheus and Grafana configuration
Deploy a local Prometheus and Grafana stack with Docker Compose
During this lab we will run the Prometheus and Grafana in Docker Compose.
Configuration for this lab is based on https://github.com/vegasbrianc/prometheus.
In the lab VM the Prometheus docker compose project was cloned to /root/prometheus.
1). Add the scraping job definition to the Prometheus configuration file /root/prometheus/prometheus/prometheus.yml by adding (uncommenting in the lab VM) the following code within scrape_config section:
  - job_name: 'btm-nodejs'
    scrape_interval: 20s
    static_configs:
    - targets: ['xxx.xxx.xxx.xxx:3001']
      labels:
        service: 'btm-nodejs'
        group: 'production'
replace xxx.xxx.xxx.xxx with your own host machine's IP. In the Skytap lab VM, the IP address should be 10.0.0.1.
2). Start Prometheus & Grafana stack:
cd /root/prometheus
docker-compose up -d
Expected output:
Creating network "prometheus_back-tier" with the default driver
Creating network "prometheus_front-tier" with the default driver
Creating prometheus_cadvisor_1      ... done
Creating prometheus_alertmanager_1  ... done
Creating prometheus_node-exporter_1 ... done
Creating prometheus_prometheus_1    ... done
Creating prometheus_grafana_1       ... done
Verify that Prometheus server was started via: http://localhost:9090 Check the status of scraping targets in Prometheus UI -> Status -> Targets
Run example PromQL queries
Generate some application load before running the queries:
cd ~/b2m-nodejs/src/
./load_test.sh
Run the following example PromQL queries using the Prometheus UI.
Throughput
Error rate
Range[0,1]: number of 5xx requests / total number of requests
sum(increase(http_request_duration_ms_count{code=~"^5..$"}[1m])) / sum(increase(http_request_duration_ms_count[1m]))
Expected value ~0.2 because our application should return 500 for about 20% of transactions.
Request Per Minute
sum(rate(http_request_duration_ms_count[1m])) by (service, route, method, code) * 60
Check the graph.
Response Time
Apdex
Apdex score approximation: 100ms target and 300ms tolerated response time
(sum(rate(http_request_duration_ms_bucket{le="100"}[1m])) by (service) + sum(rate(http_request_duration_ms_bucket{le="300"}[1m])) by (service)
) / 2 / sum(rate(http_request_duration_ms_count[1m])) by (service)
Note that we divide the sum of both buckets. The reason is that the histogram buckets are cumulative. The le="100" bucket is also contained in the le="300" bucket; dividing it by 2 corrects for that. - Prometheus docs
95th Response Time
histogram_quantile(0.95, sum(rate(http_request_duration_ms_bucket[1m])) by (le, service, route, method))
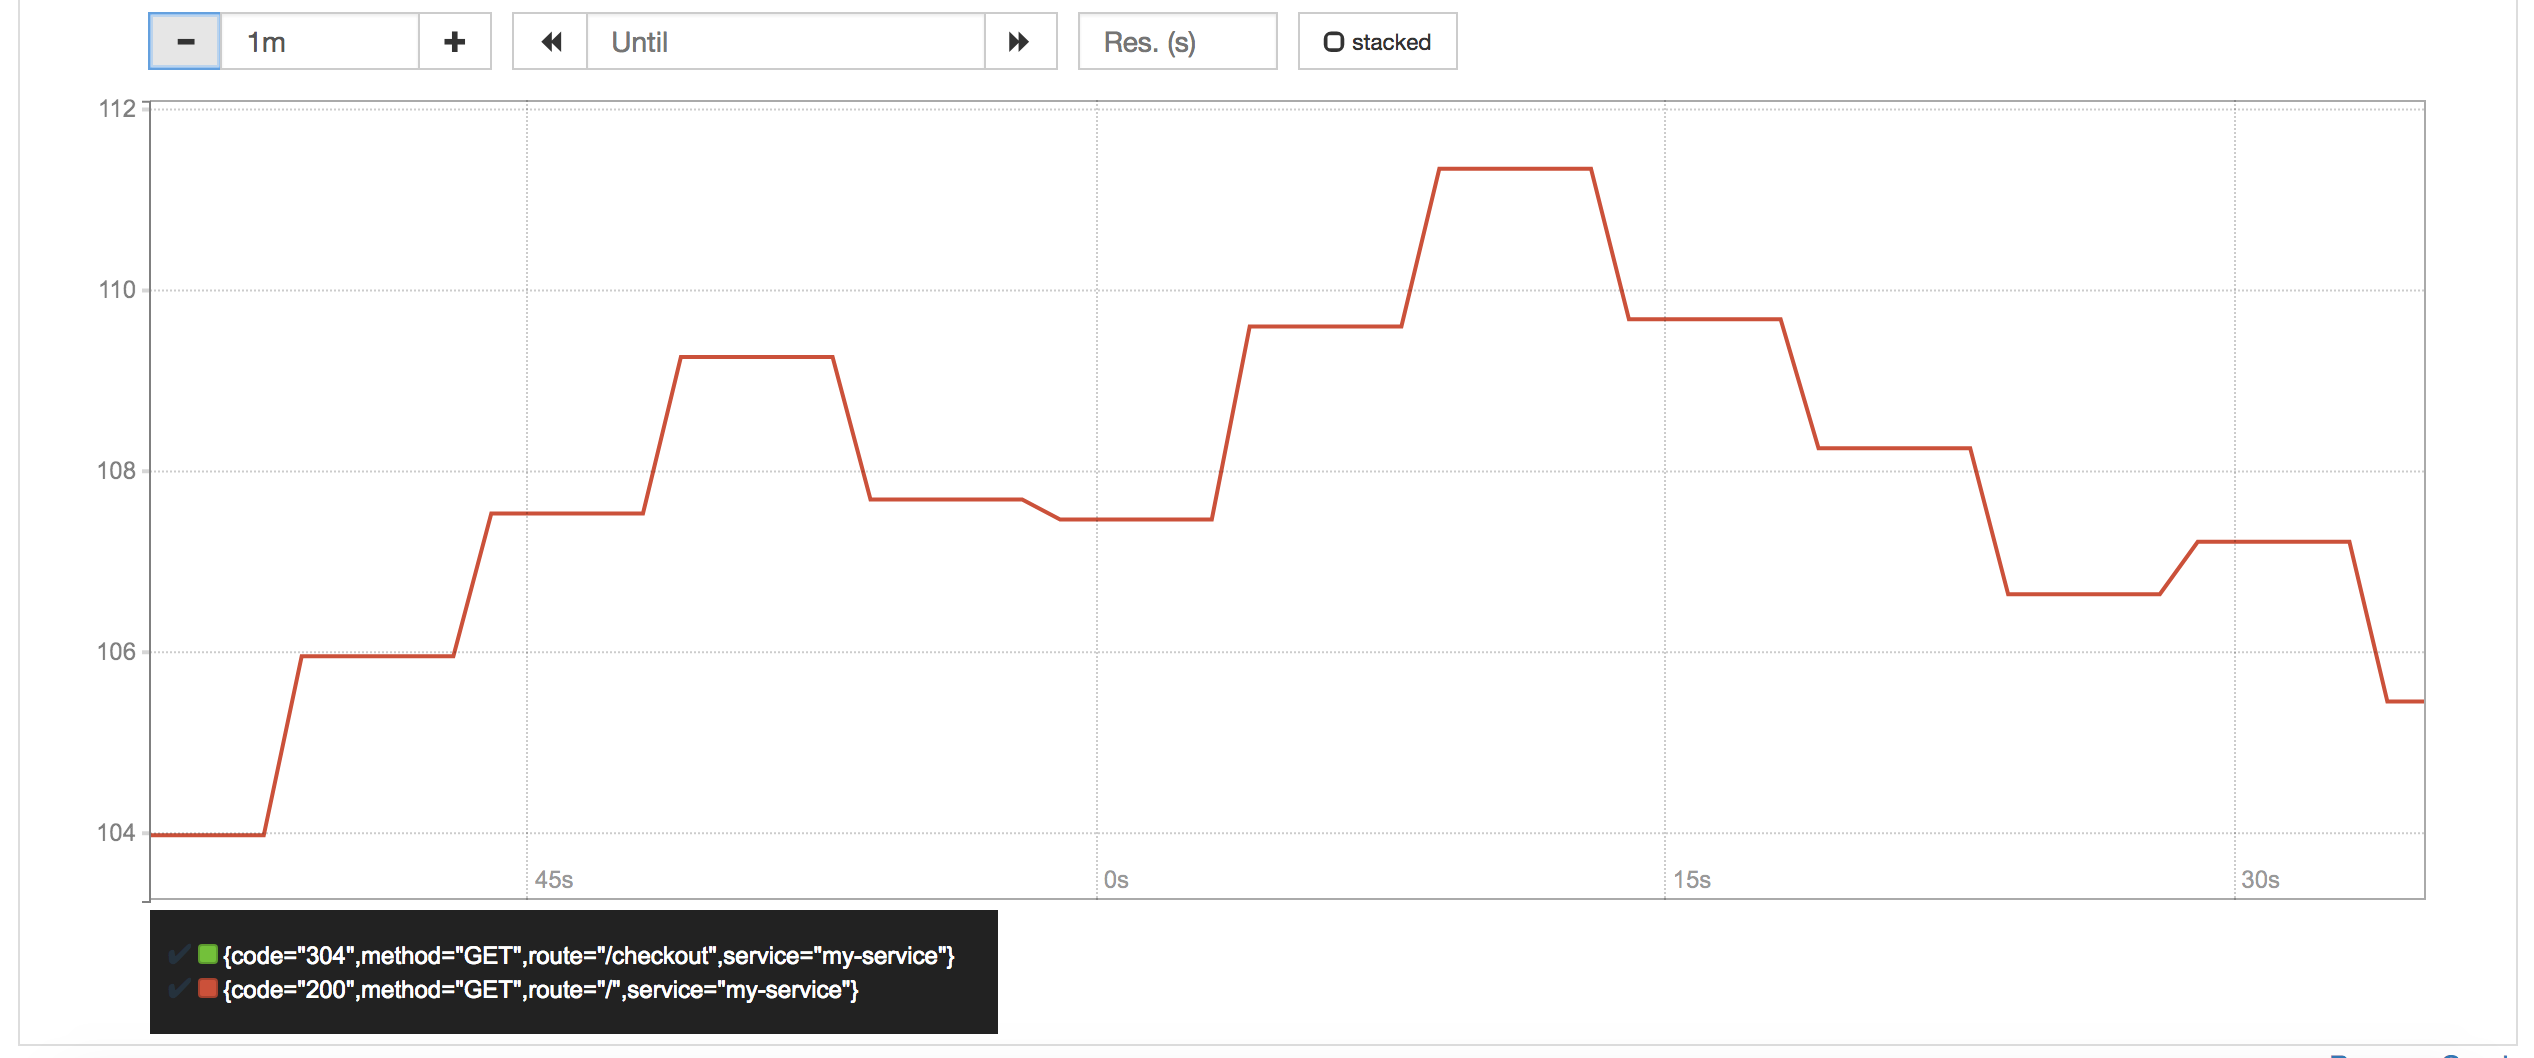
Median Response Time
histogram_quantile(0.5, sum(rate(http_request_duration_ms_bucket[1m])) by (le, service, route, method))
Average Response Time
avg(rate(http_request_duration_ms_sum[1m]) / rate(http_request_duration_ms_count[1m])) by (service, route, method, code)
Memory Usage
Average Memory Usage
In Megabytes.
avg(nodejs_external_memory_bytes / 1024 ) by (service)
Configure Prometheus alert
Alerting rules allows to define alert conditions based on Prometheus expression language expressions and to send notifications about firing alerts to an external service. In this lab we will configure one alerting rule for median response time higher than 100ms.
Lab instruction:
Add the following alert rule to the alert.rules file. In the lab VM it is located in /root/prometheus/prometheus/alert.rules
  - alert: APIHighMedianResponseTime
    expr: histogram_quantile(0.5, sum by(le, service, route, method) (rate(http_request_duration_ms_bucket[1m])))
      > 30
    for: 1m
    annotations:
      description: '{{ $labels.service }}, {{ $labels.method }} {{ $labels.route }}
        has a median response time above 100ms (current value: {{ $value }}ms)'
      summary: High median response time on {{ $labels.service }} and {{ $labels.method
        }} {{ $labels.route }}
Restart the Prometheus stack:
cd ~/prometheus
docker-compose down
docker-compose up -d
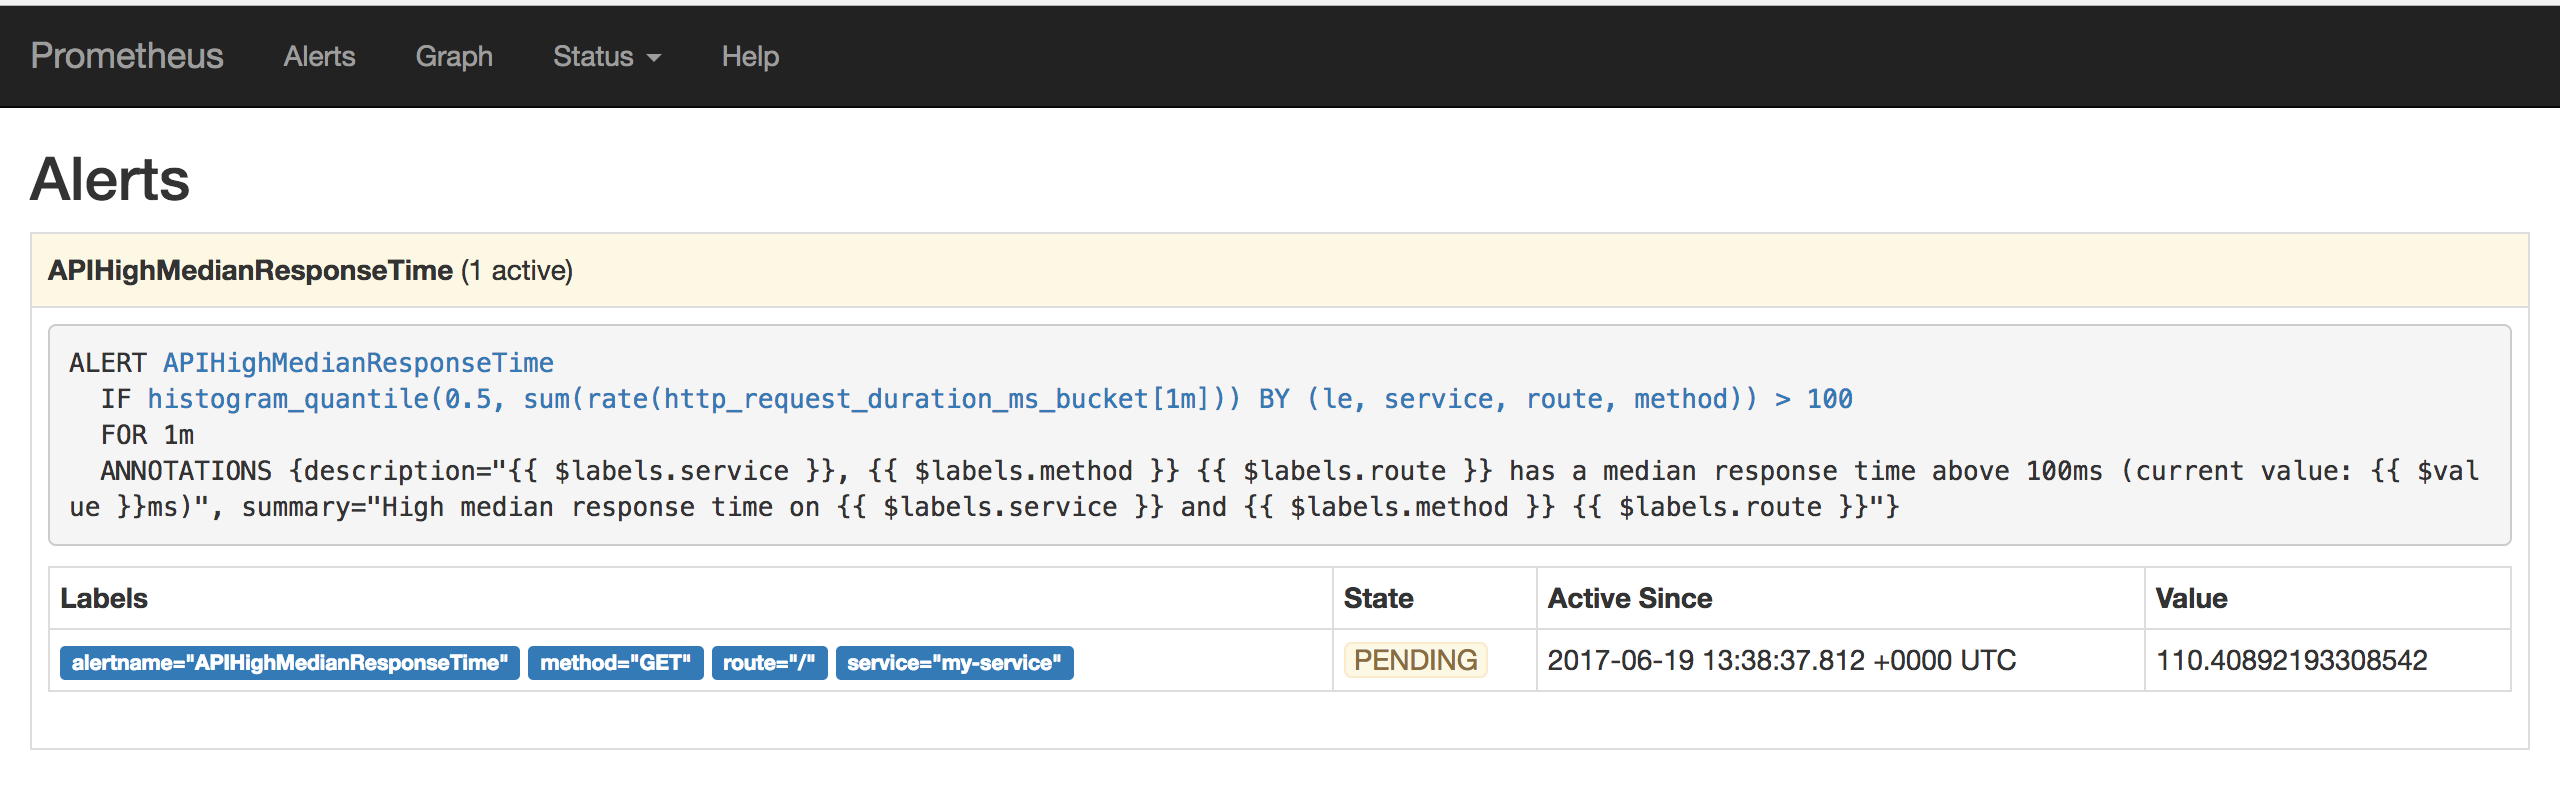
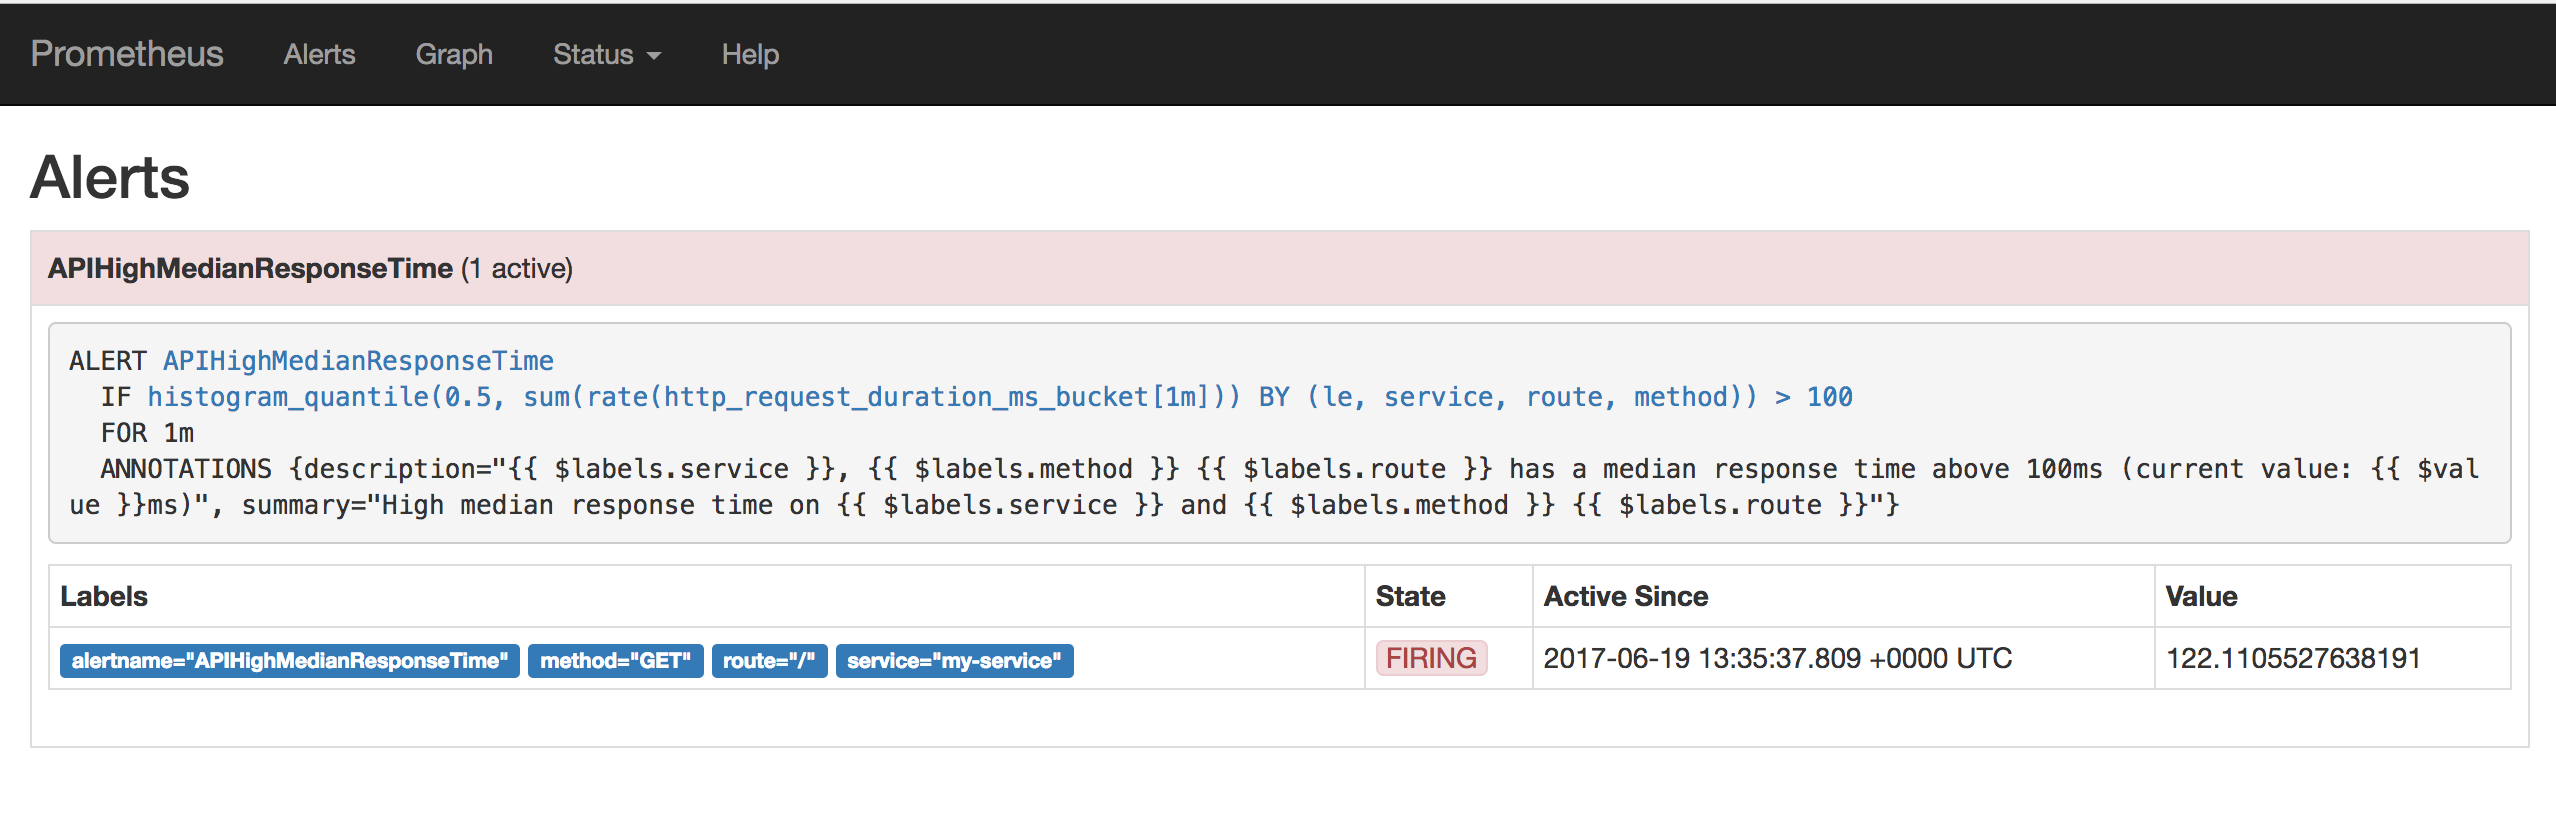
Alerts can be listed via Prometheus UI: http://localhost:9090/alerts
States of active alerts:
pending:
firing:
Set the Prometheus datasource in Grafana
Logon to Grafana via http://localhost:3000
- user: admin
- password: foobar
Verify the prometheus datasource configuration in Grafana. If it was not already configured, create a Grafana datasource with these settings:
- name: Prometheus
- type: prometheus
- url: http://localhost:9090
- access: browser
Configure dashboard
Grafana Dashboard to import: ~/b2m-nodejs/src/btm-nodejs-grafana.json
Monitoring dashboard was created according to the RED Method principles:
- Rate (
ThoughputandCheckoutspanels) - Errors (
Error ratepanel) - Duration (
95th Response TimeandMedian Response Timepanels)
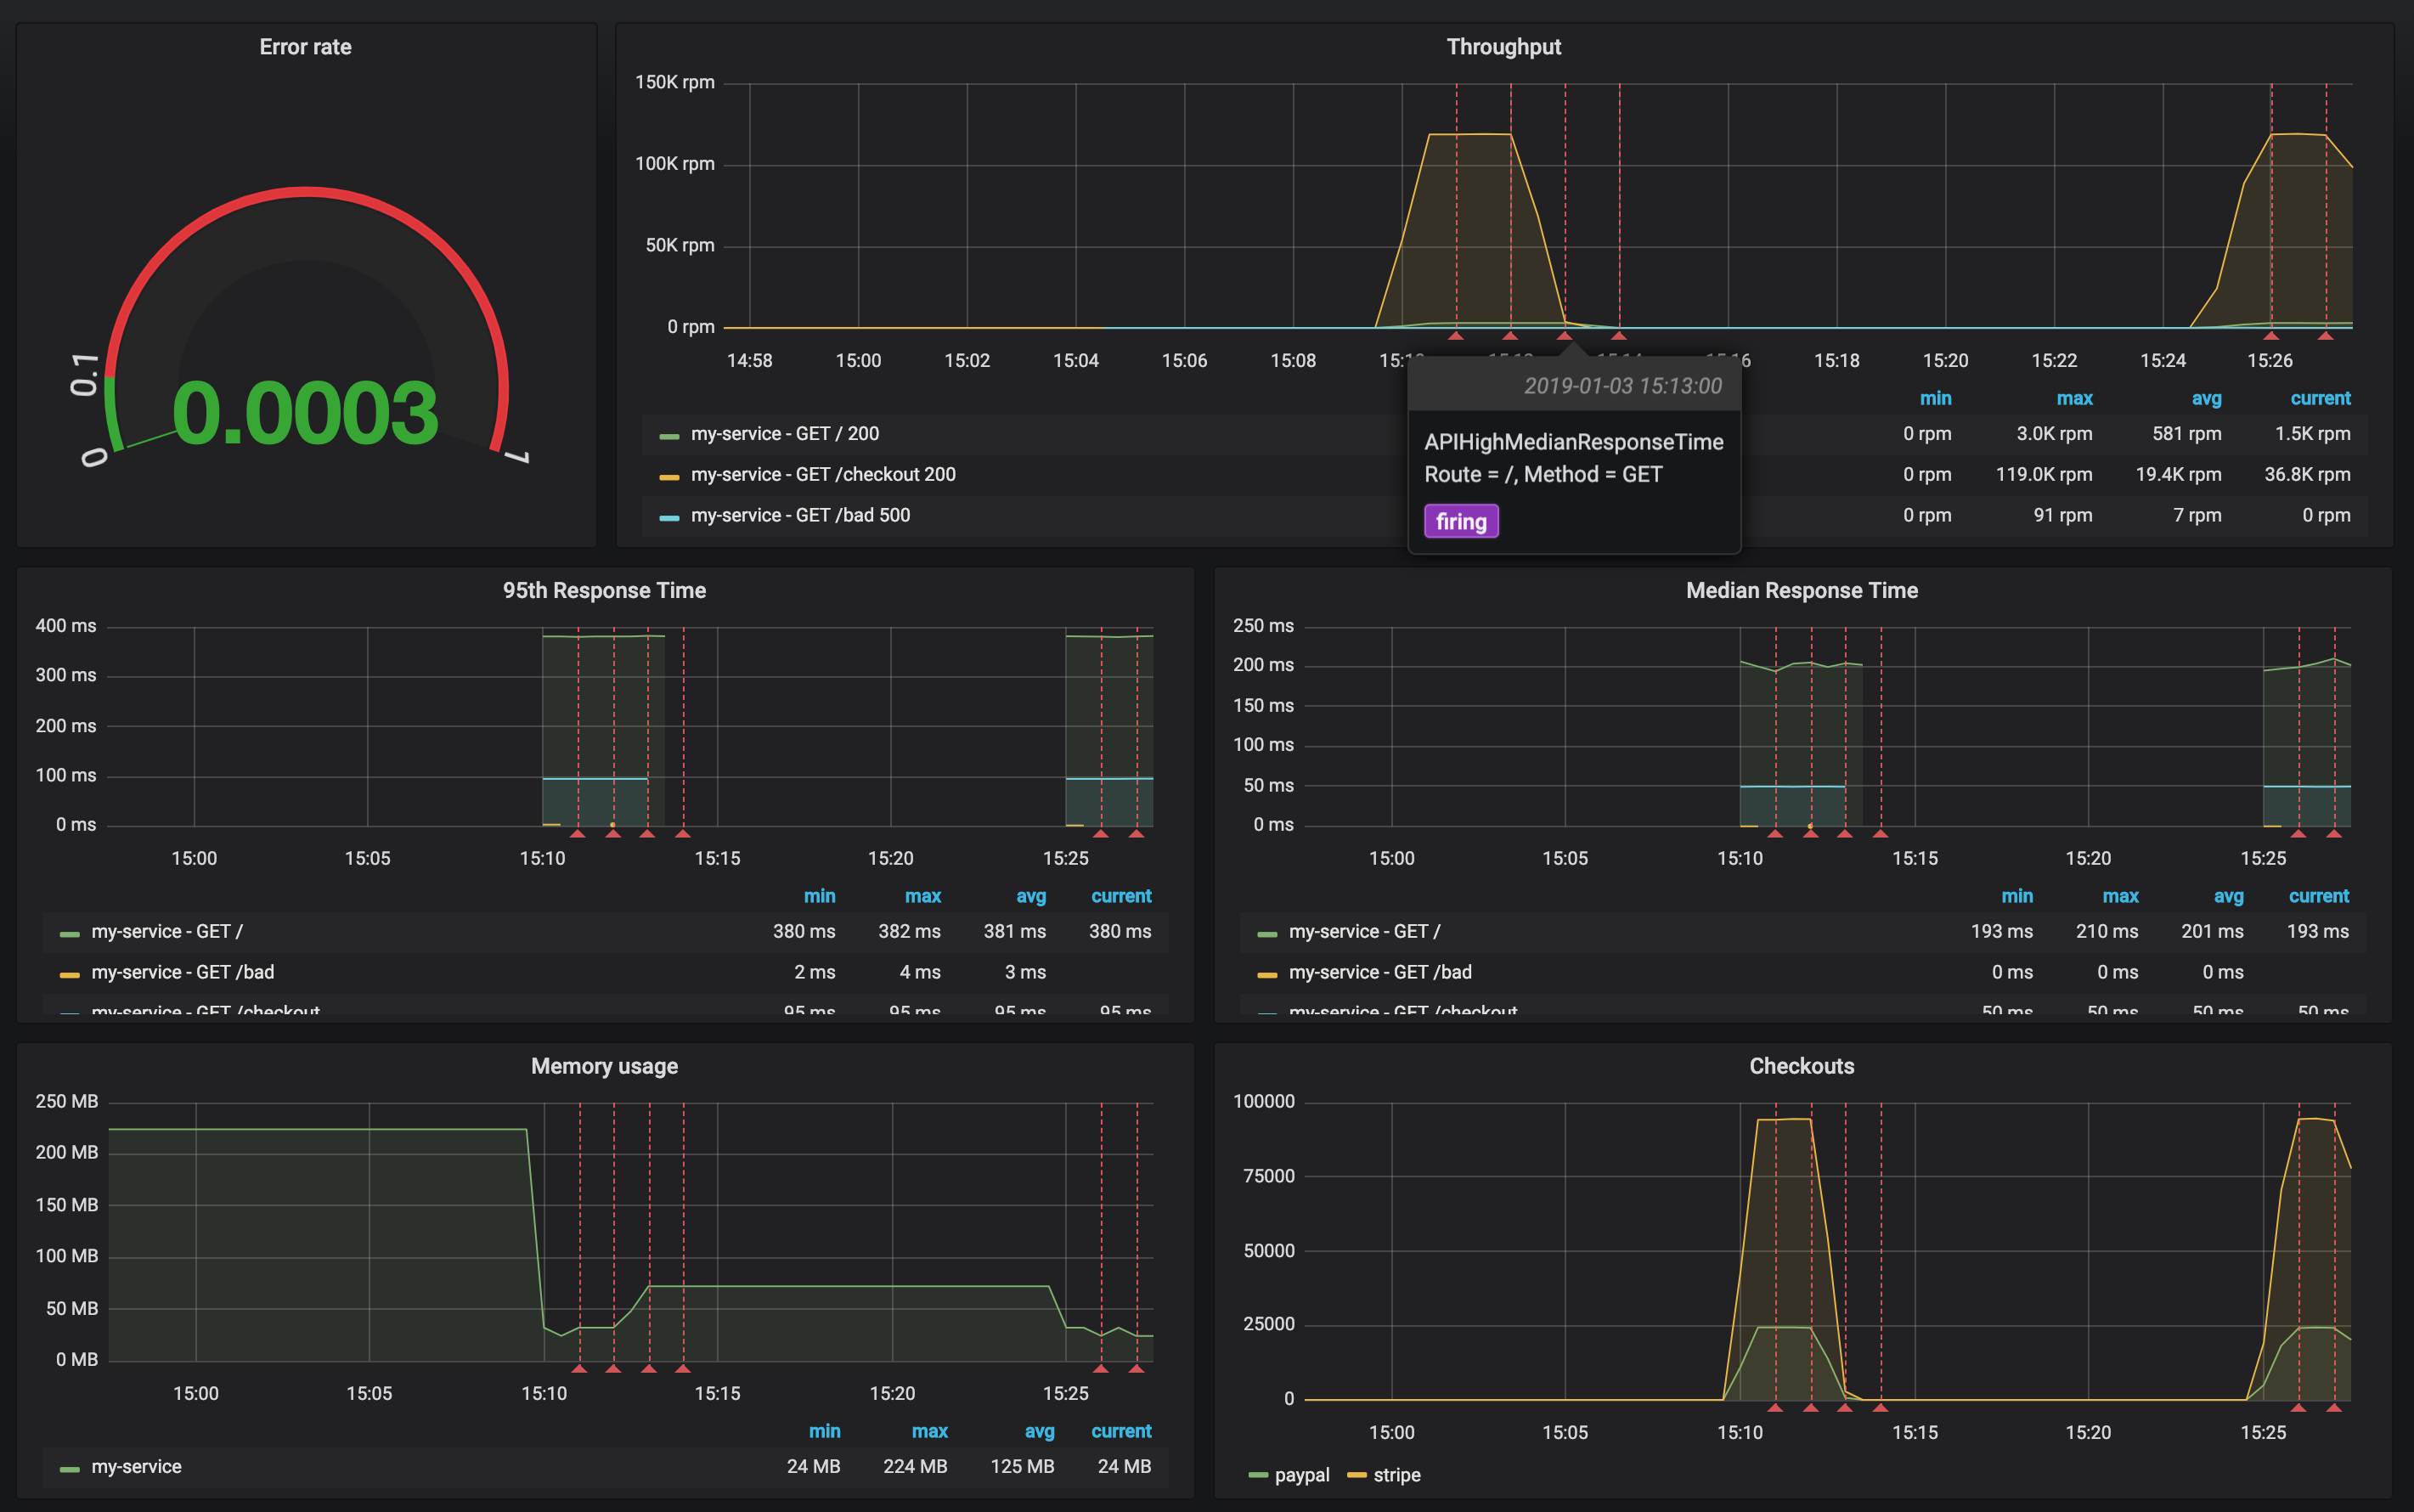
Review the configuration of each dashboard panel. Check the annotation settings.
Define the Apdex score chart using the following query:
(sum(rate(http_request_duration_ms_bucket{le="100"}[1m])) by (service) + sum(rate(http_request_duration_ms_bucket{le="300"}[1m])) by (service)
) / 2 / sum(rate(http_request_duration_ms_count[1m])) by (service)
You can add it to the existing dashboard:
- Click on the icon
Add paneland selectGraphpanel type. - Click on the panel title and select edit.
- Select
Prometheusdatasource in theMetricstab of the panel query editor - Copy PromQL to the free form field
- Verify the results on the panel preview
- Explore other Graph panel options
Every time you need to generate an application traffic, use provided script ~/b2m-nodejs/src/load_test.sh