Demonstrating Event Streams from A to Z
Warning
This exercise is not a step by step lab, but more an explanation of all the concepts and components involved in an event-driven solution with Event Streams. We have provided scripts that can be leveraged (see the table of content on the right to get scripts) to demonstrate and talk about those items in front of your prospect.
A typical demonstration script will include at least the following subjects (See right navigation bar to go to a specific sections):
- Review Event Streams Components
- Operator based deployment and Day 2 operations
- Topic creation
- Producer application
- Consumer application, consumer group concepts, offset concepts
- User access, authentication mechanism
- Monitoring
- Event Streaming
- Geo-replication
As education enablement you can go step by step following the current structure. As a reusable asset for your future demonstration, you can pick and choose from the right navigation bar the items to highlight in front of your audiance.
All the demonstration can be done on IBM CoC clusters: see the environments section in the EDA labs introduction.
Pre-requisites
You will need access to an Event Streams instance installed on an OpenShift cluster with access to the OpenShift Console to demonstrate Operators.
You’ll need the following as well:
- git client
-
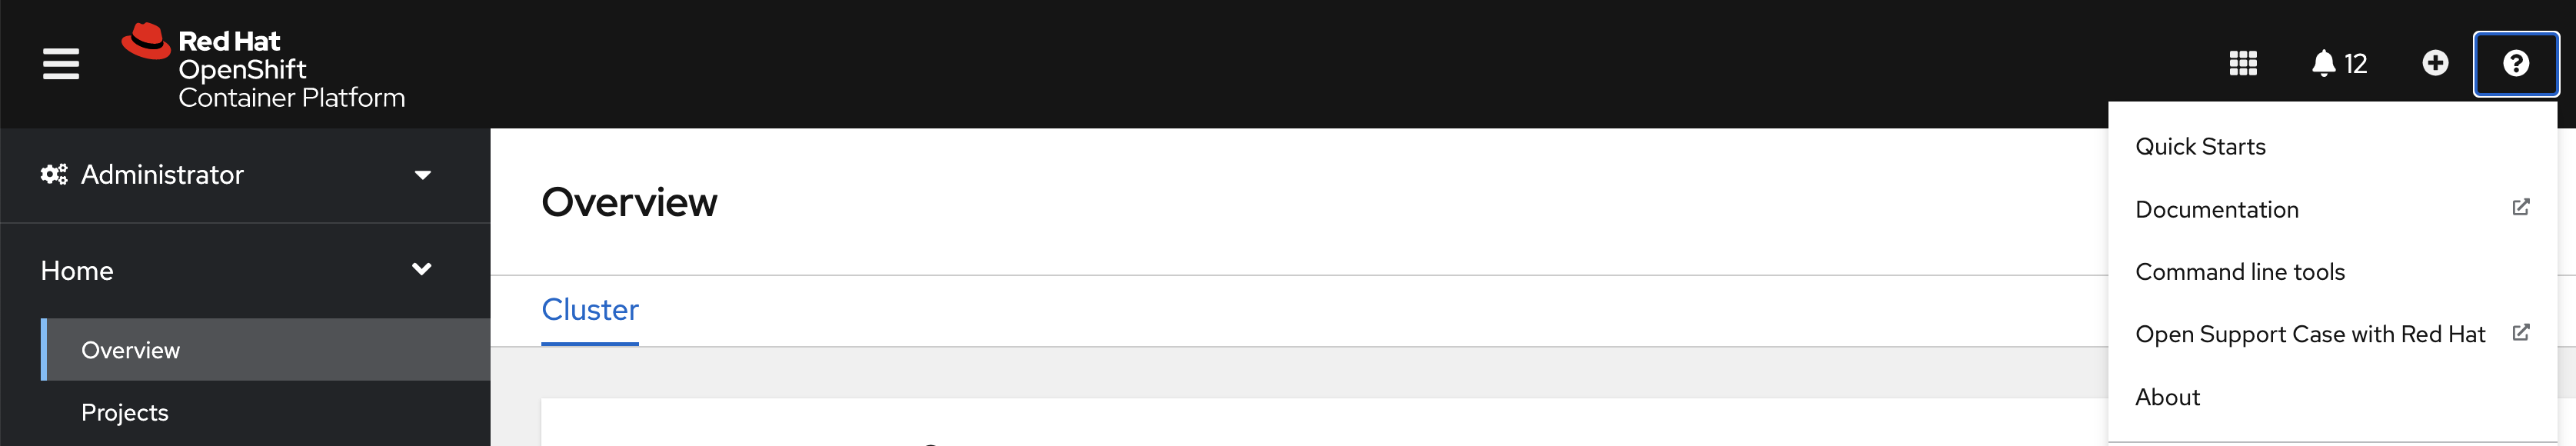
Have oc cli installed. It can be done once connected to the OpenShift cluster using the <?> icon on the top-right and "Command Line Tool" menu.
-
Get docker desktop or podman on your local laptop
- Java 11 is need to run the Event Streams starter application.
Review Event Streams components
Narative: Event Streams is the IBM packaging of different Open Source projects to support an integrated user experience deploying and managing Kafka on OpenShift cluster. The following figure illustrates such components:
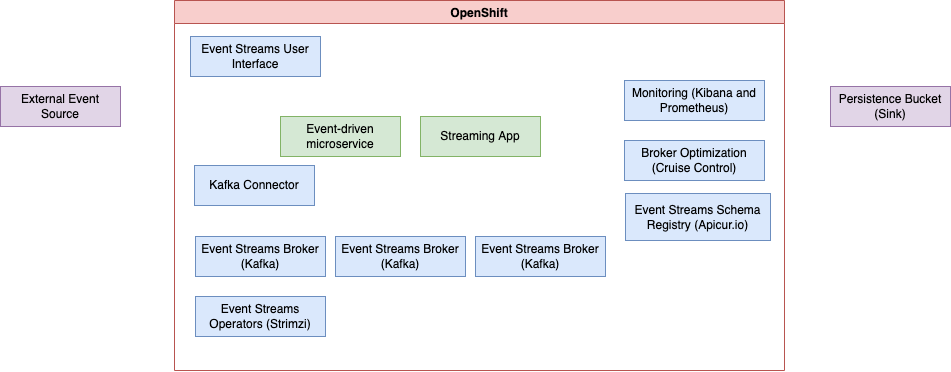
- Event streams (Apache Kafka packaging) runs on OpenShift cluster.
- The deployment and the continuous monitoring of Event Streams resources definition and deployed resources is done via Operator (Strimzi open source project)
- Event Streams offers a user interface to manage resources and exposes simple dashboard. We will use it during the demonstration.
- The schema management is done via schema registry and the feature is integrated in Event Streams user interface but in the back end, is supported by Apicur.io registry
- External event sources can be integrated via the Kafka Connector framework and Event Streams offers a set of connectors and can partner to other companies to get specific connectors.
- External sinks can be used to persist messages for longer time period that the retention settings done at the topic level. S3 buckets can be use, IBM Cloud object storage, and Kafka Sink connectors. There is this cloud object storage lab, or S3 sink with Apache Camel lab to present such integrations.
- Event Streams monitoring is done using Dashboards in Event Streams user interface but also within OpenShift monitoring and Kibana dashboards.
- Green components are application specifics, and represent event-driven microservices (see eda-quickstart project for code templates) or Kafka Streaming apps, or Apache Flink apps.
- For cluster optimization, Event Streams integrates Cruise Control, with goal constraints, to act on cluster resource usage.
More argumentations
- Kafka is essentially a distributed platform to manage append log with a pub/sub protocol to get streams of events. Messages are saved for a long period of time.
- Kafka connectors can also being supported by APP Connect integration capabilities or Apache Camel kafka connectors.
- To learn more about Kafka Connector see our summary
Concepts
If needed there are some important concepts around Kafka to present to your audience. See this kafka technology overview.
High Availability
High availability is ensured by avoiding single point of failure, parallel, and replications. The following figure is a golden topology for OpenShift with Event Streams components deployed to it. Event Streams Brokers run in OpenShift worker nodes, and it may be relevant to use one broker per worker nodes using zone affinity policies.
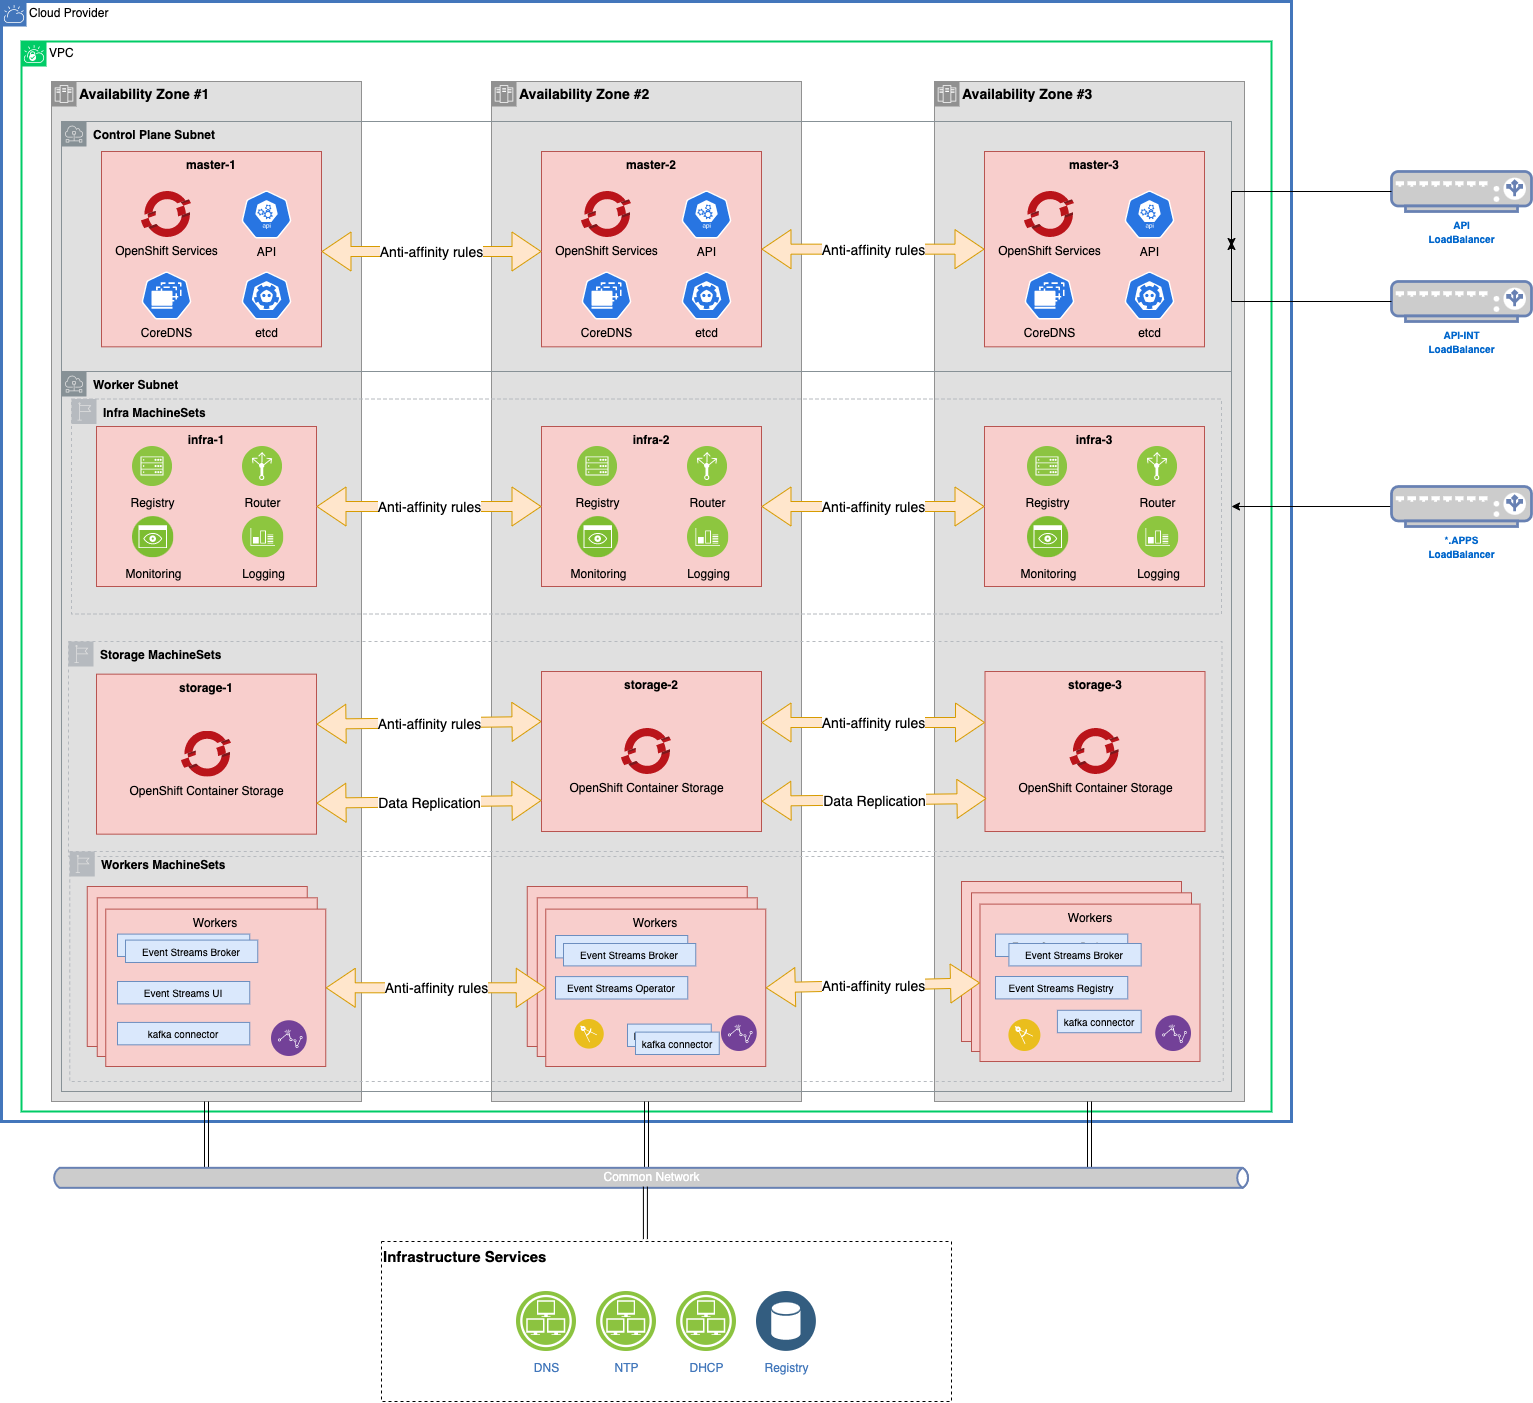
Kafka connectors, or streaming applications runs in worker node too and access brokers via mutual TLS authentication and SSL encryption.
Kafka brokers are spread across worker nodes using anti-affinity policies.
Read more
- Kafka High availability deeper dive
- See the OpenShift golden topology article in production deployment site.
- A production deployment descriptor for Event Streams
- Product documentation on planning installation
Operator based deployment
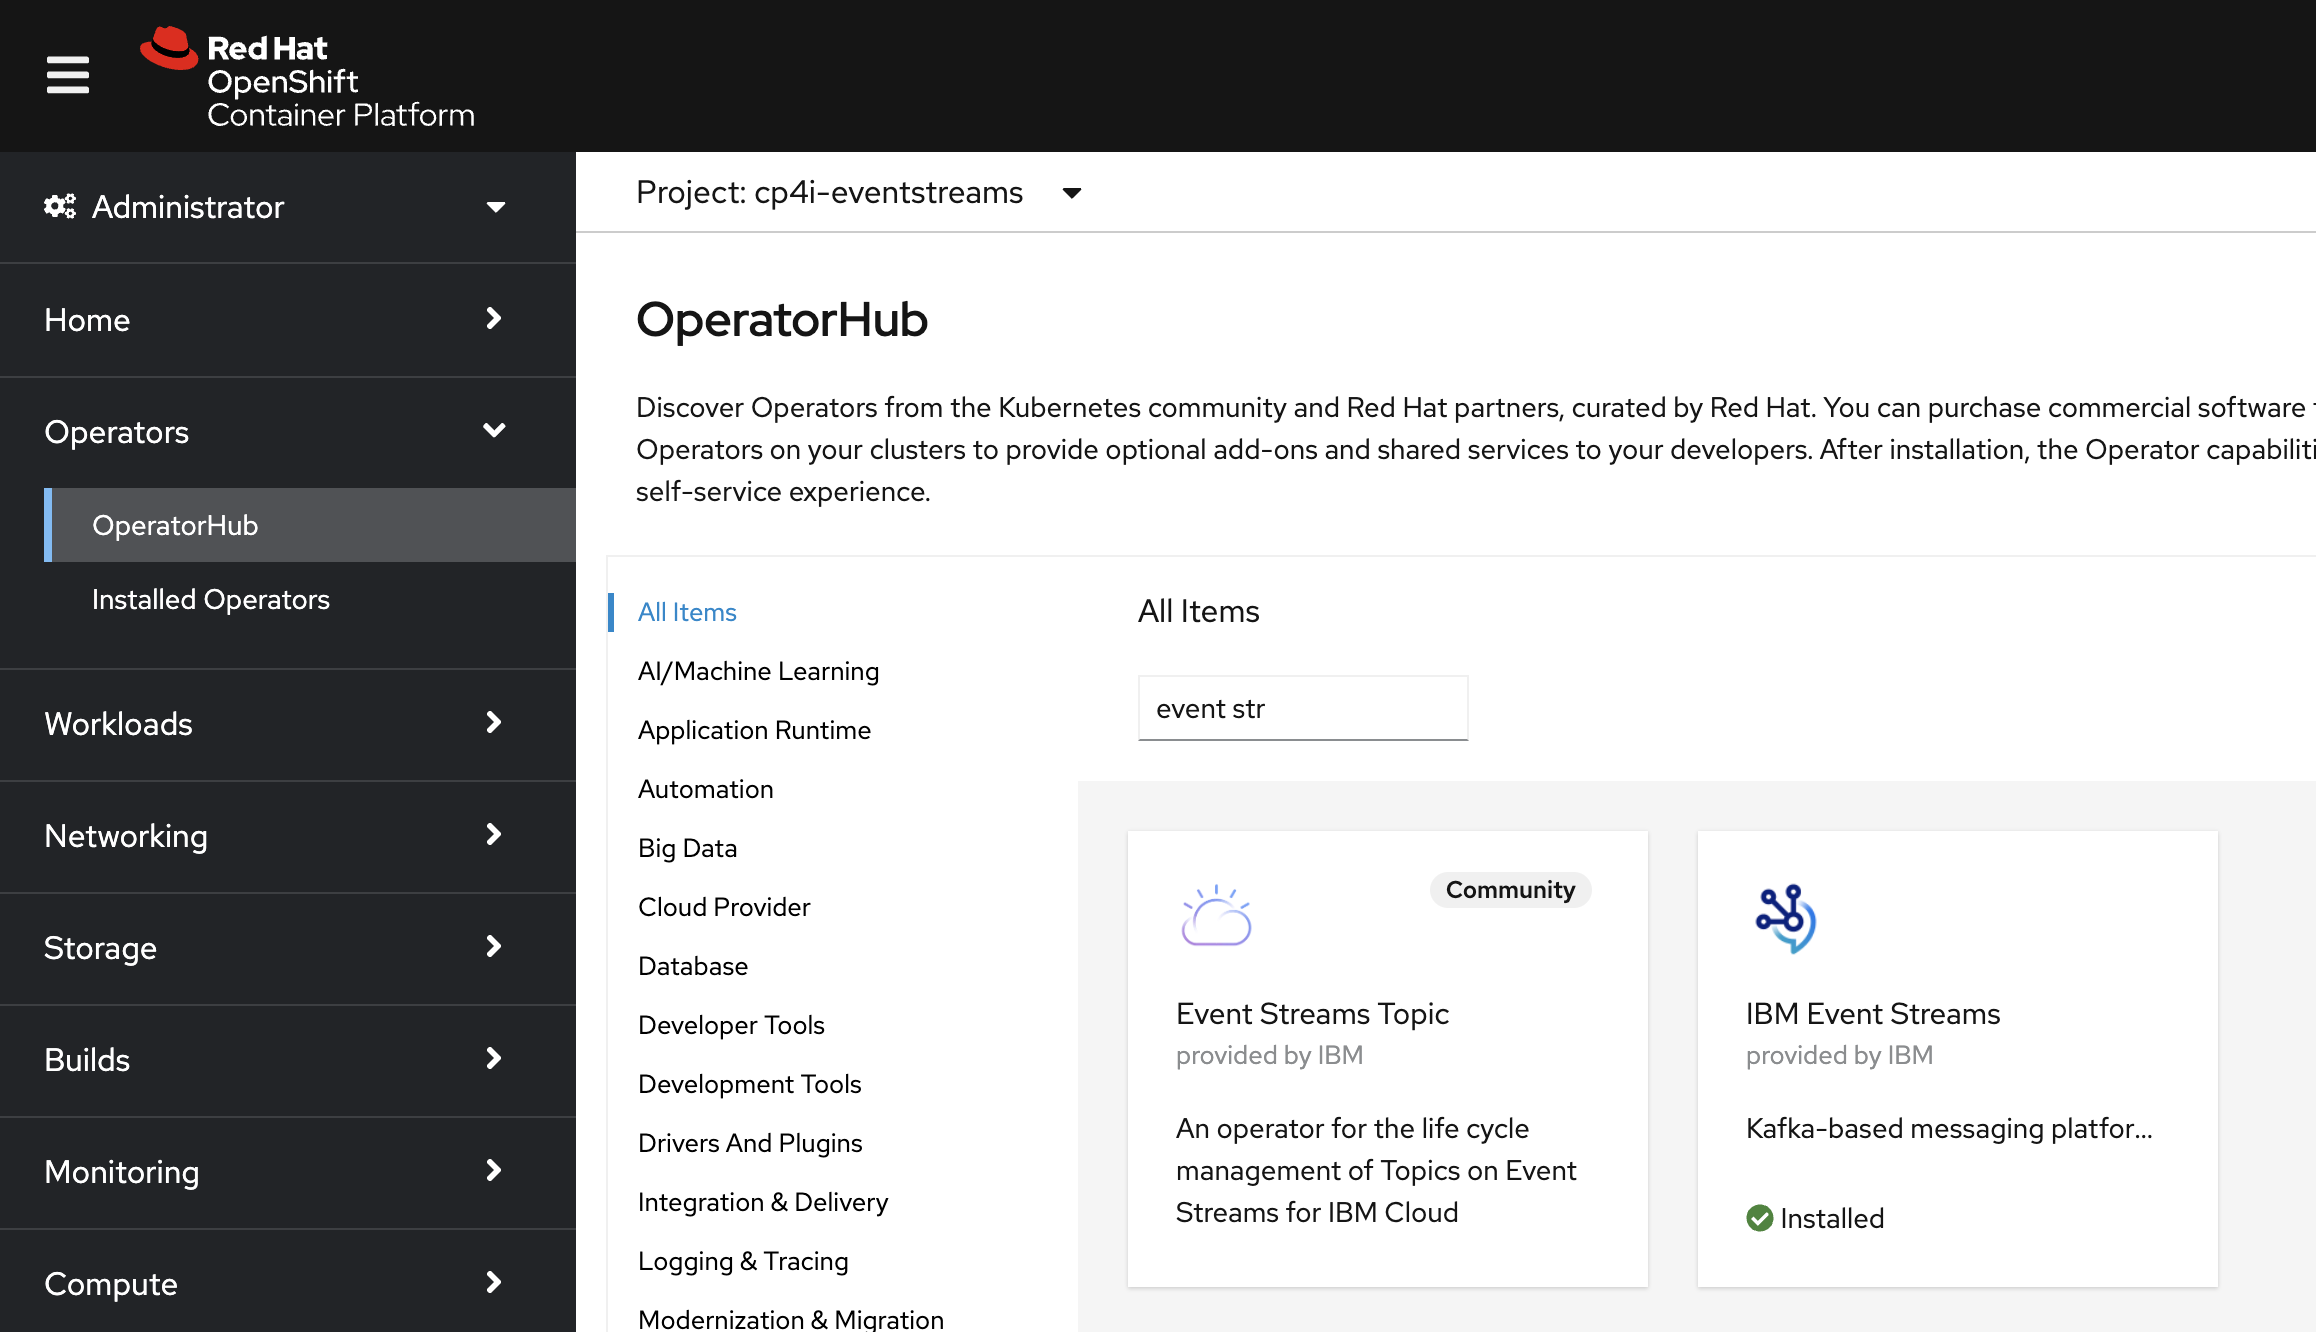
There are several ways to install Event Streams. We are going to look at this, with Operator Hub.
-
Go to your Openshift console, select Operator Hub and search for Event Streams. Here you can install the operator to manage all cluster instances deployed to the OpenShift environment. Operator can automatically deploy new product version once released by IBM.
-
In the OpenShift Console, select the project where Event Streams is deployed. On left menu select
Operators > Installed Operators, scroll to select IBM Event Streams, you are now in the Operator user interface, from where you can see local resources and create new one.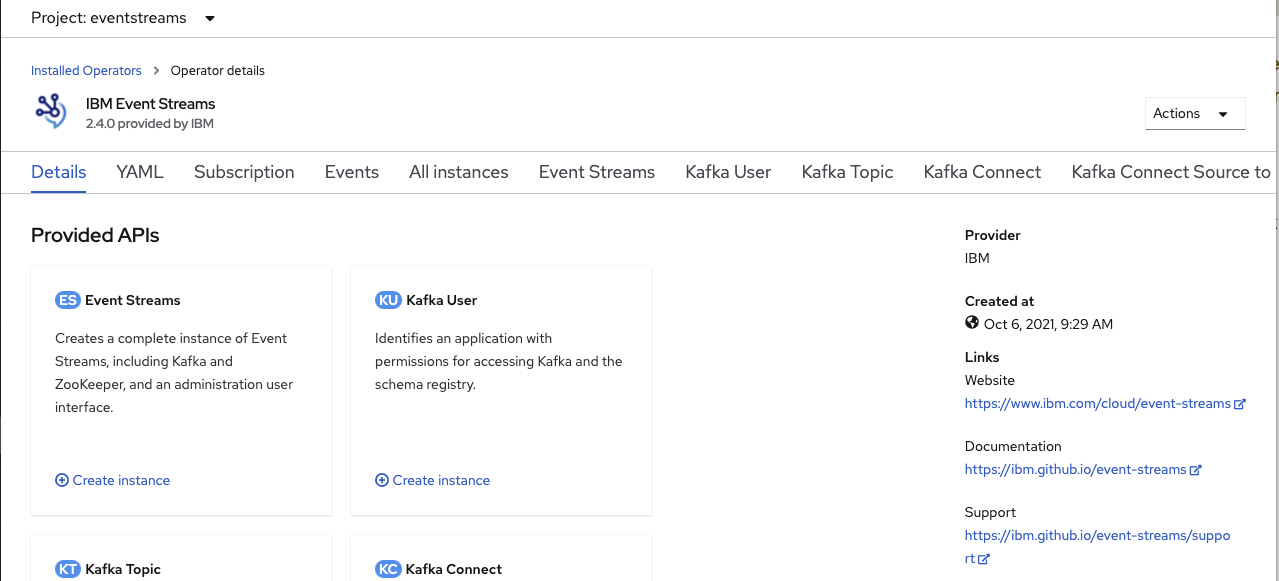
-
Go to the
Event Streamsmenu and select existing cluster definition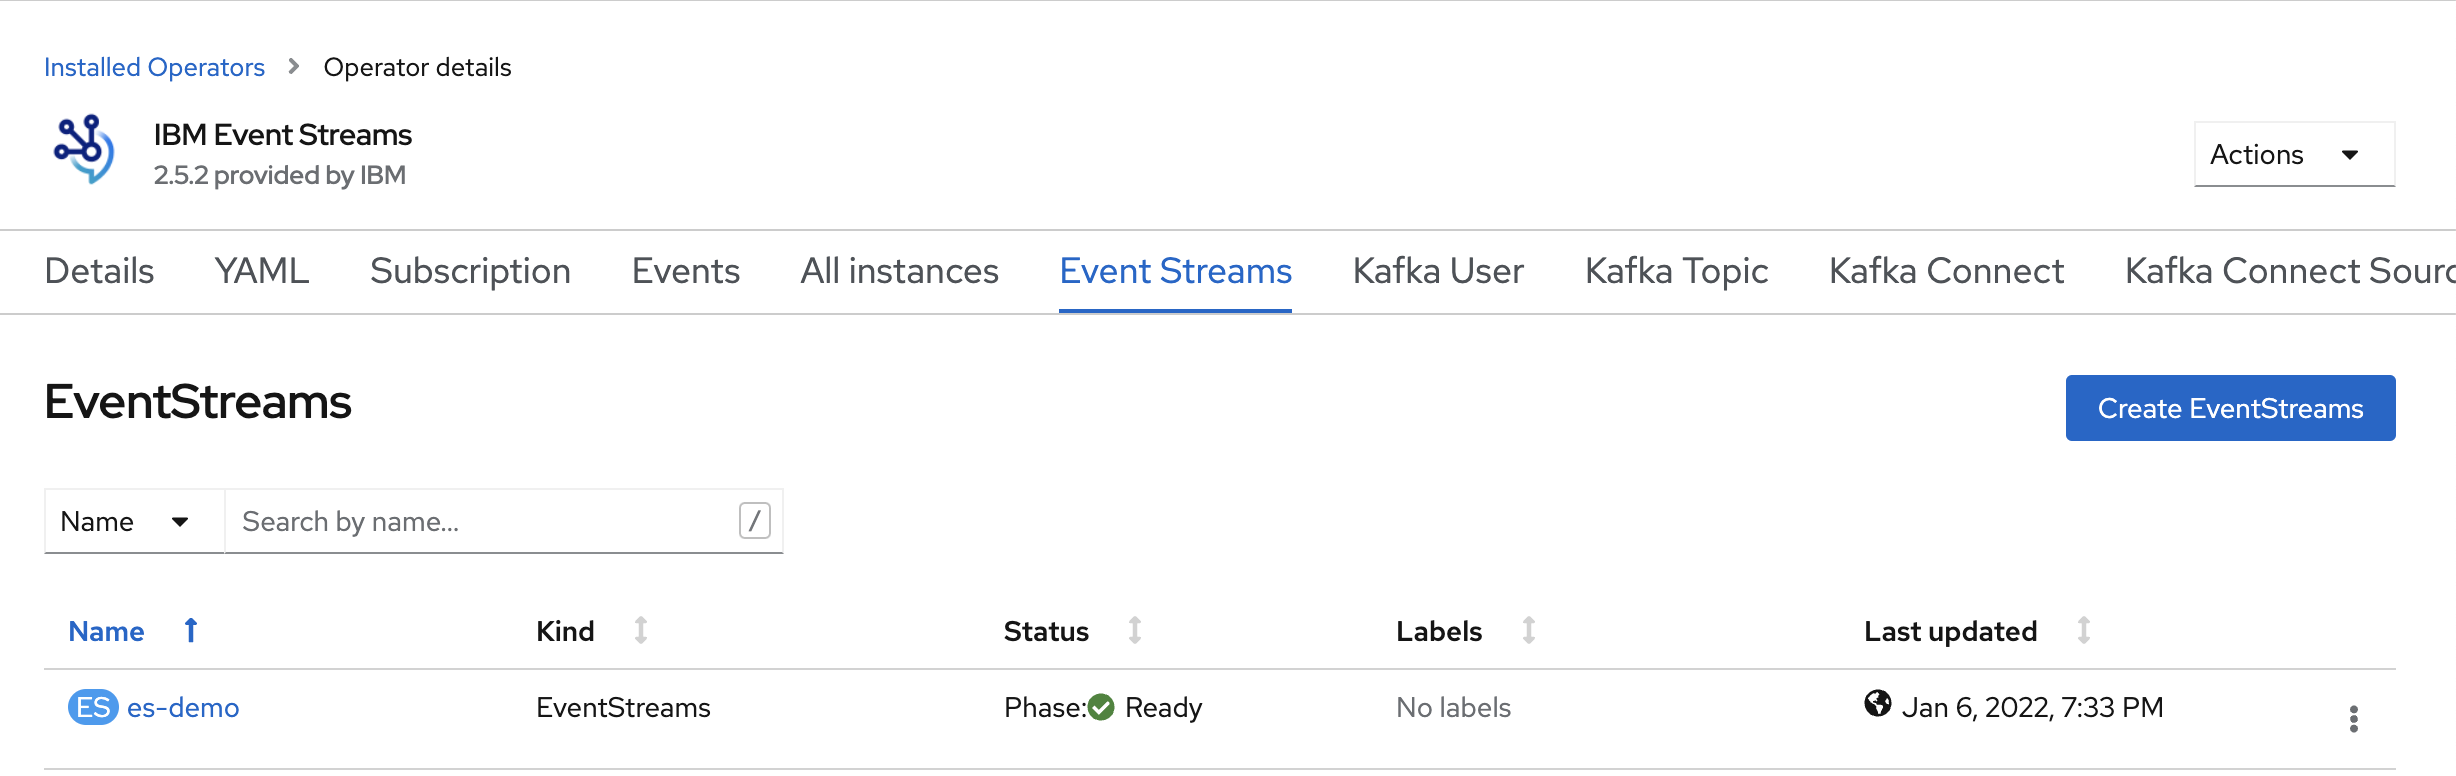
-
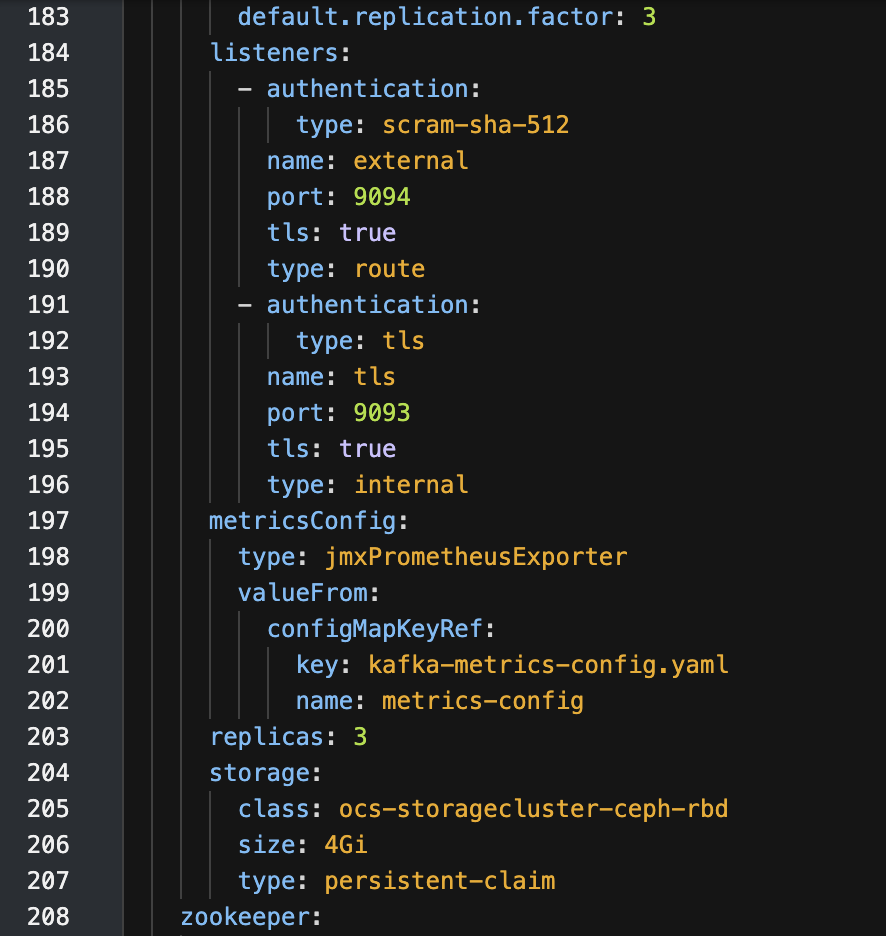
You are now viewing the cluster definition as it is deployed. Select the
YAMLchoice and see thespecelements.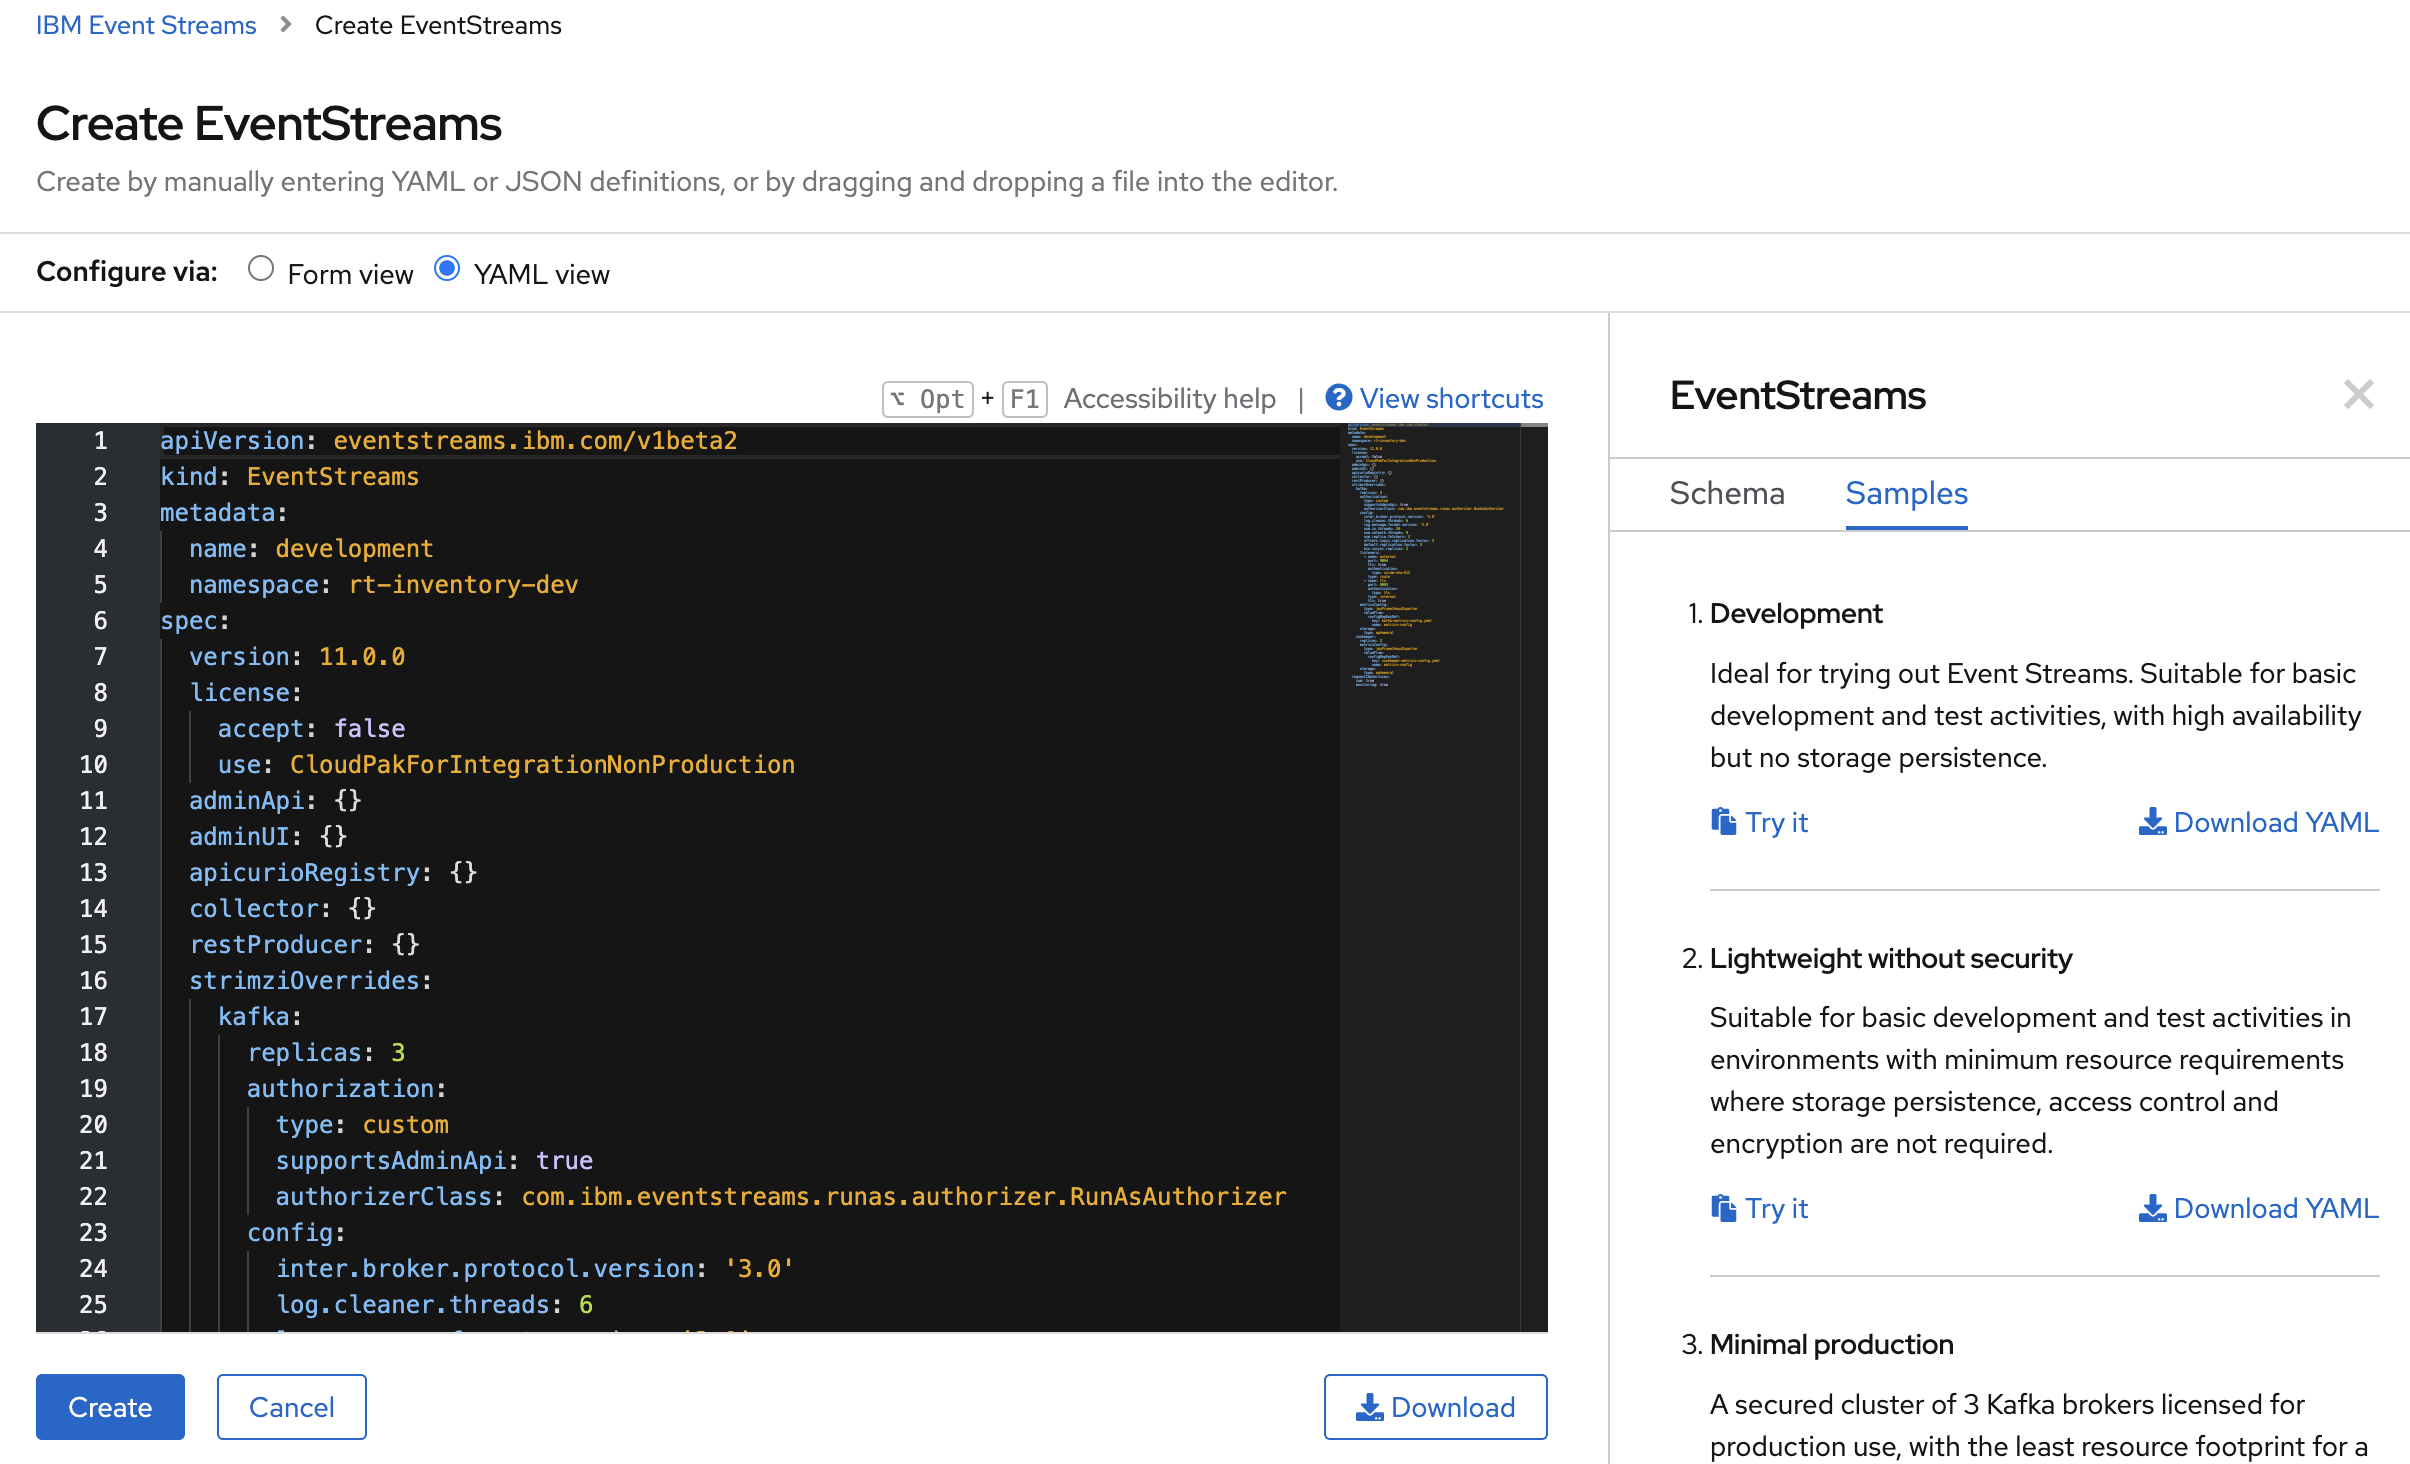
You can see how easy it would be simple to add a broker by changing the
spec.strimziOverrides.kafka.replicasvalue. Also in this view, theSamplesmenu presents some examples of cluster definitions. Kafka brokers, Zookeeper nodes or other components like Apicurio can all be scaled to meet your needs:- Number of replicas
- CPU request or limit settings
- Memory request or limit settings
- JVM settings
-
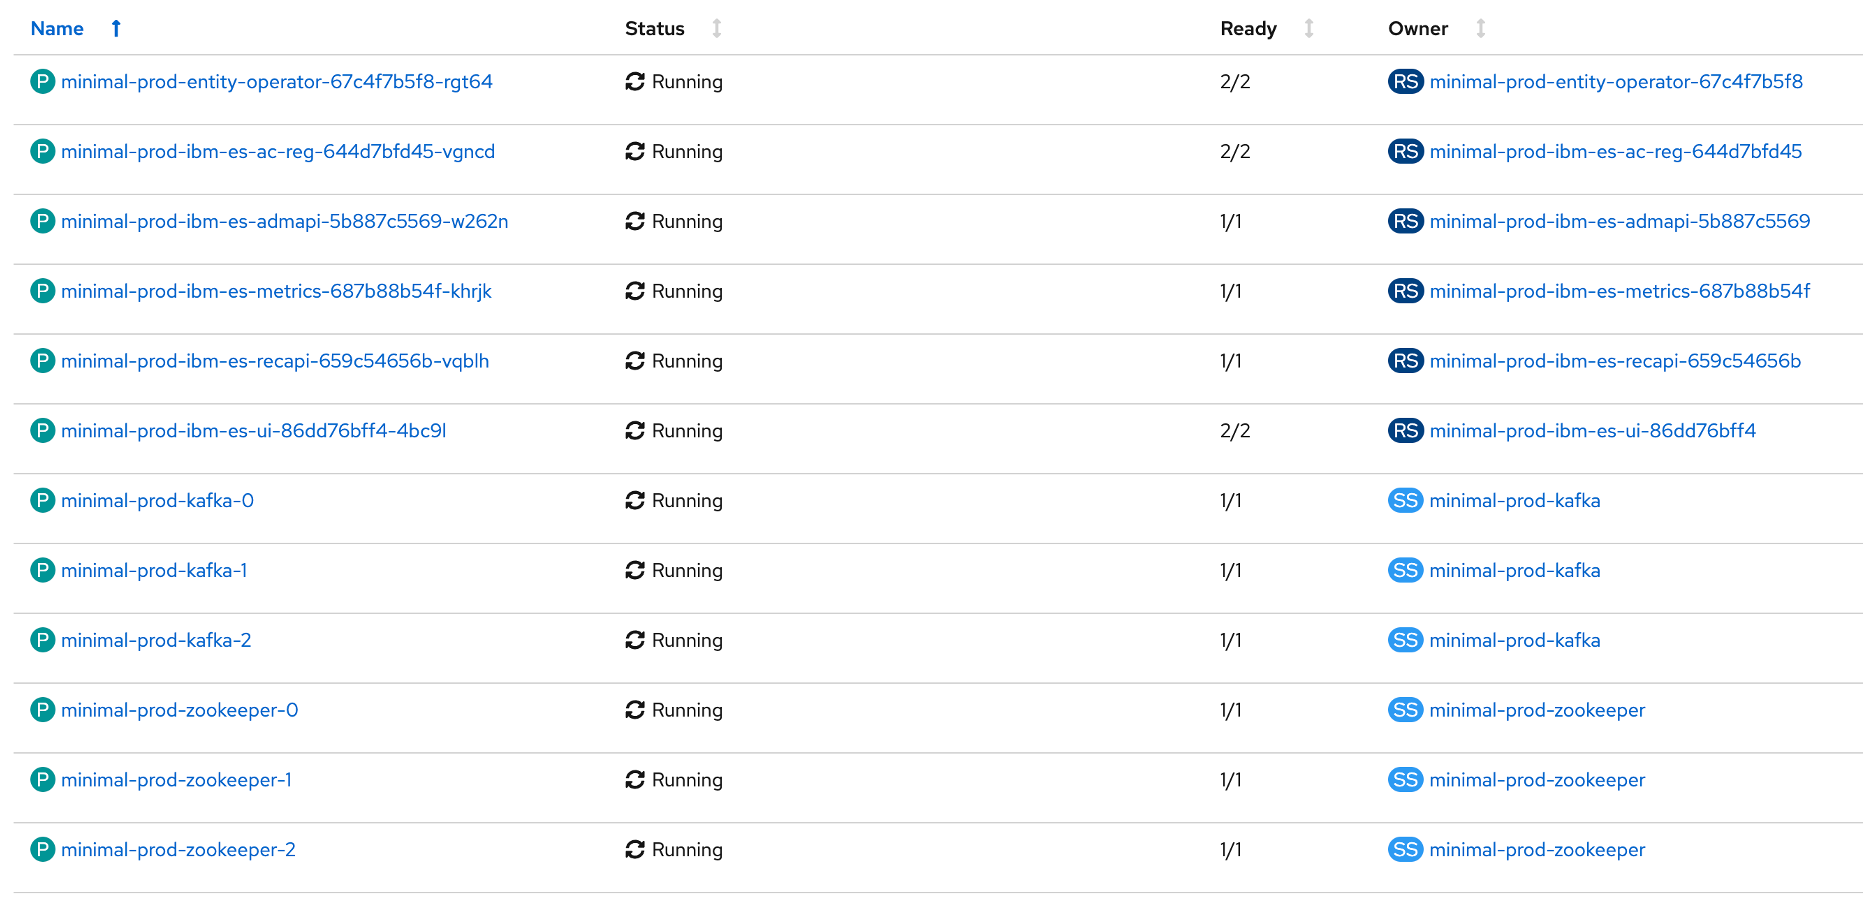
On the left side menu select Workloads->Pods. Here you see pods that are in the Event Streams namespace like Broker, zookeepers, user interface, schema registry:
-
If needed, you can explain the concept of persistence and Storage class: Kafka save records on disk for each broker, and so it can use VM disk or network file systems. As Kubernetes deployed application, Event Streams define persistence via persistence claim and expected quality of service using storage class.
On the left side menu select,
Storage > PersistenceVolumesClaimsin the OpenShift console, each broker has its own claim, OpenShift allocated Persistence Volumes with expected capacity. The Storage class was defined by OpenShift administrator, and in the example above, it use CEPH storage.
Read more
Review Event Streams user interface features
There are a number of ways to navigate to Event Streams Console by getting the exposed routes
-
Using Routes in Openshift: On the left side menu select
Networking > Routesin the OpenShift console. Findes-demo-ibm-es-uiand then go to Location. Select that link and it will take you to the Event Streams Console. Depending to your installation, you may reach Cloud Pak for Integration console, in this case, select Entreprise LDAP, and enter your userid and password.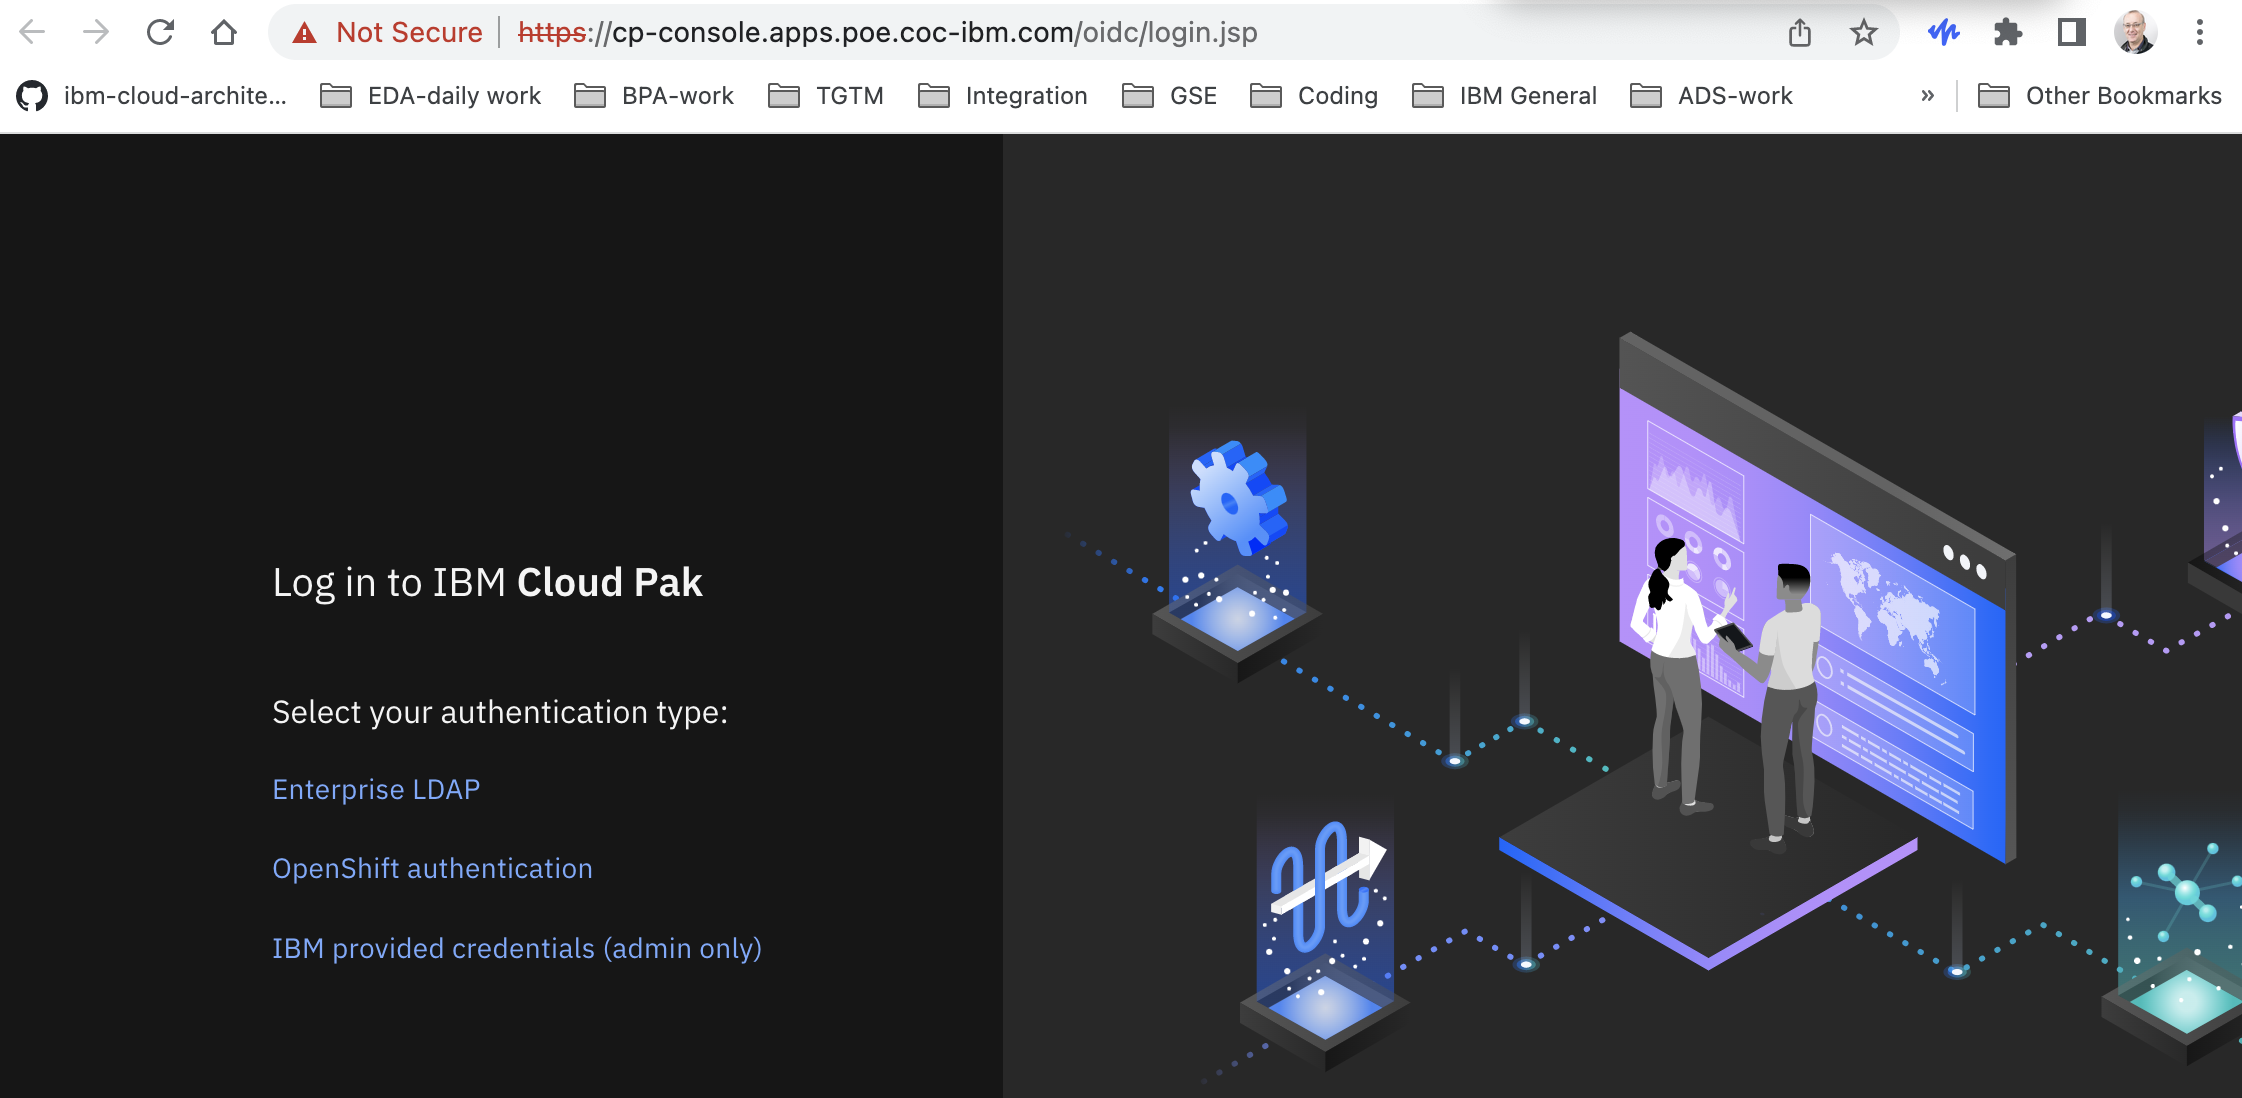
-
Using the cli: (replace
es-demowith the name of your cluster, andcp4i-eventstreamswith the name of the project where Event Streams runs into )Once you logged in using the LDAP credentials provided, you should reach the home page.
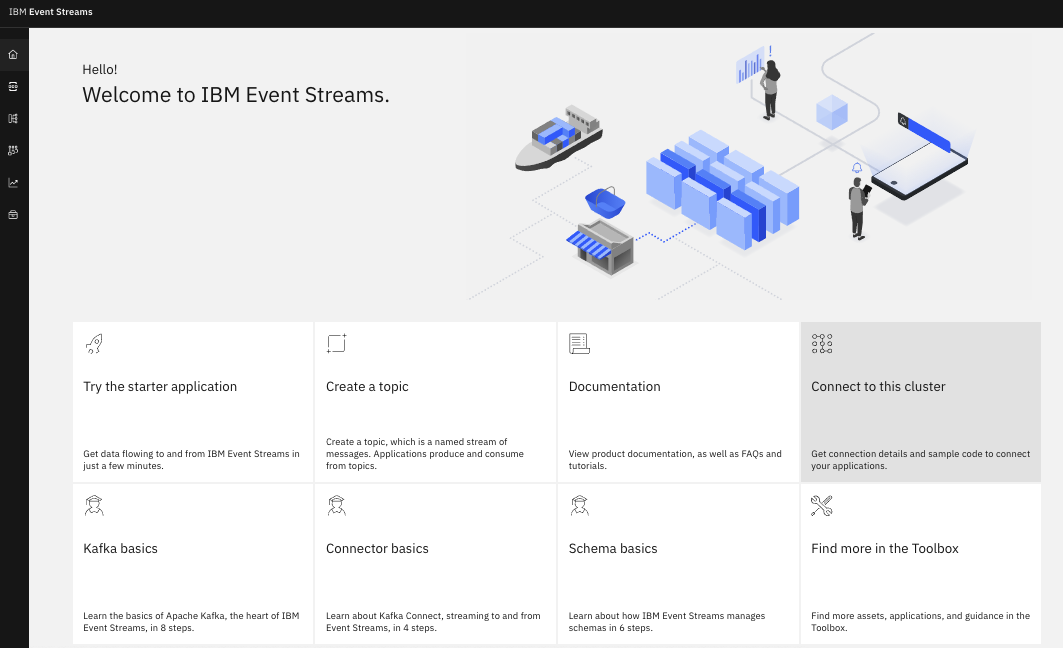
-
The set of features available from this home page, are topic management, schema registry, consumer groups, monitoring, and toolbox... you will review most of those features in this demo.
Topic management
Topics are append log, producer applications publish records to topics, and consumer applications subscribe to topics. Kafka messages themselves are immutable. Deletion and compaction of data are administrative operations.
-
Navigate to the topic main page by using the Event Streams left side menu and select Topics.
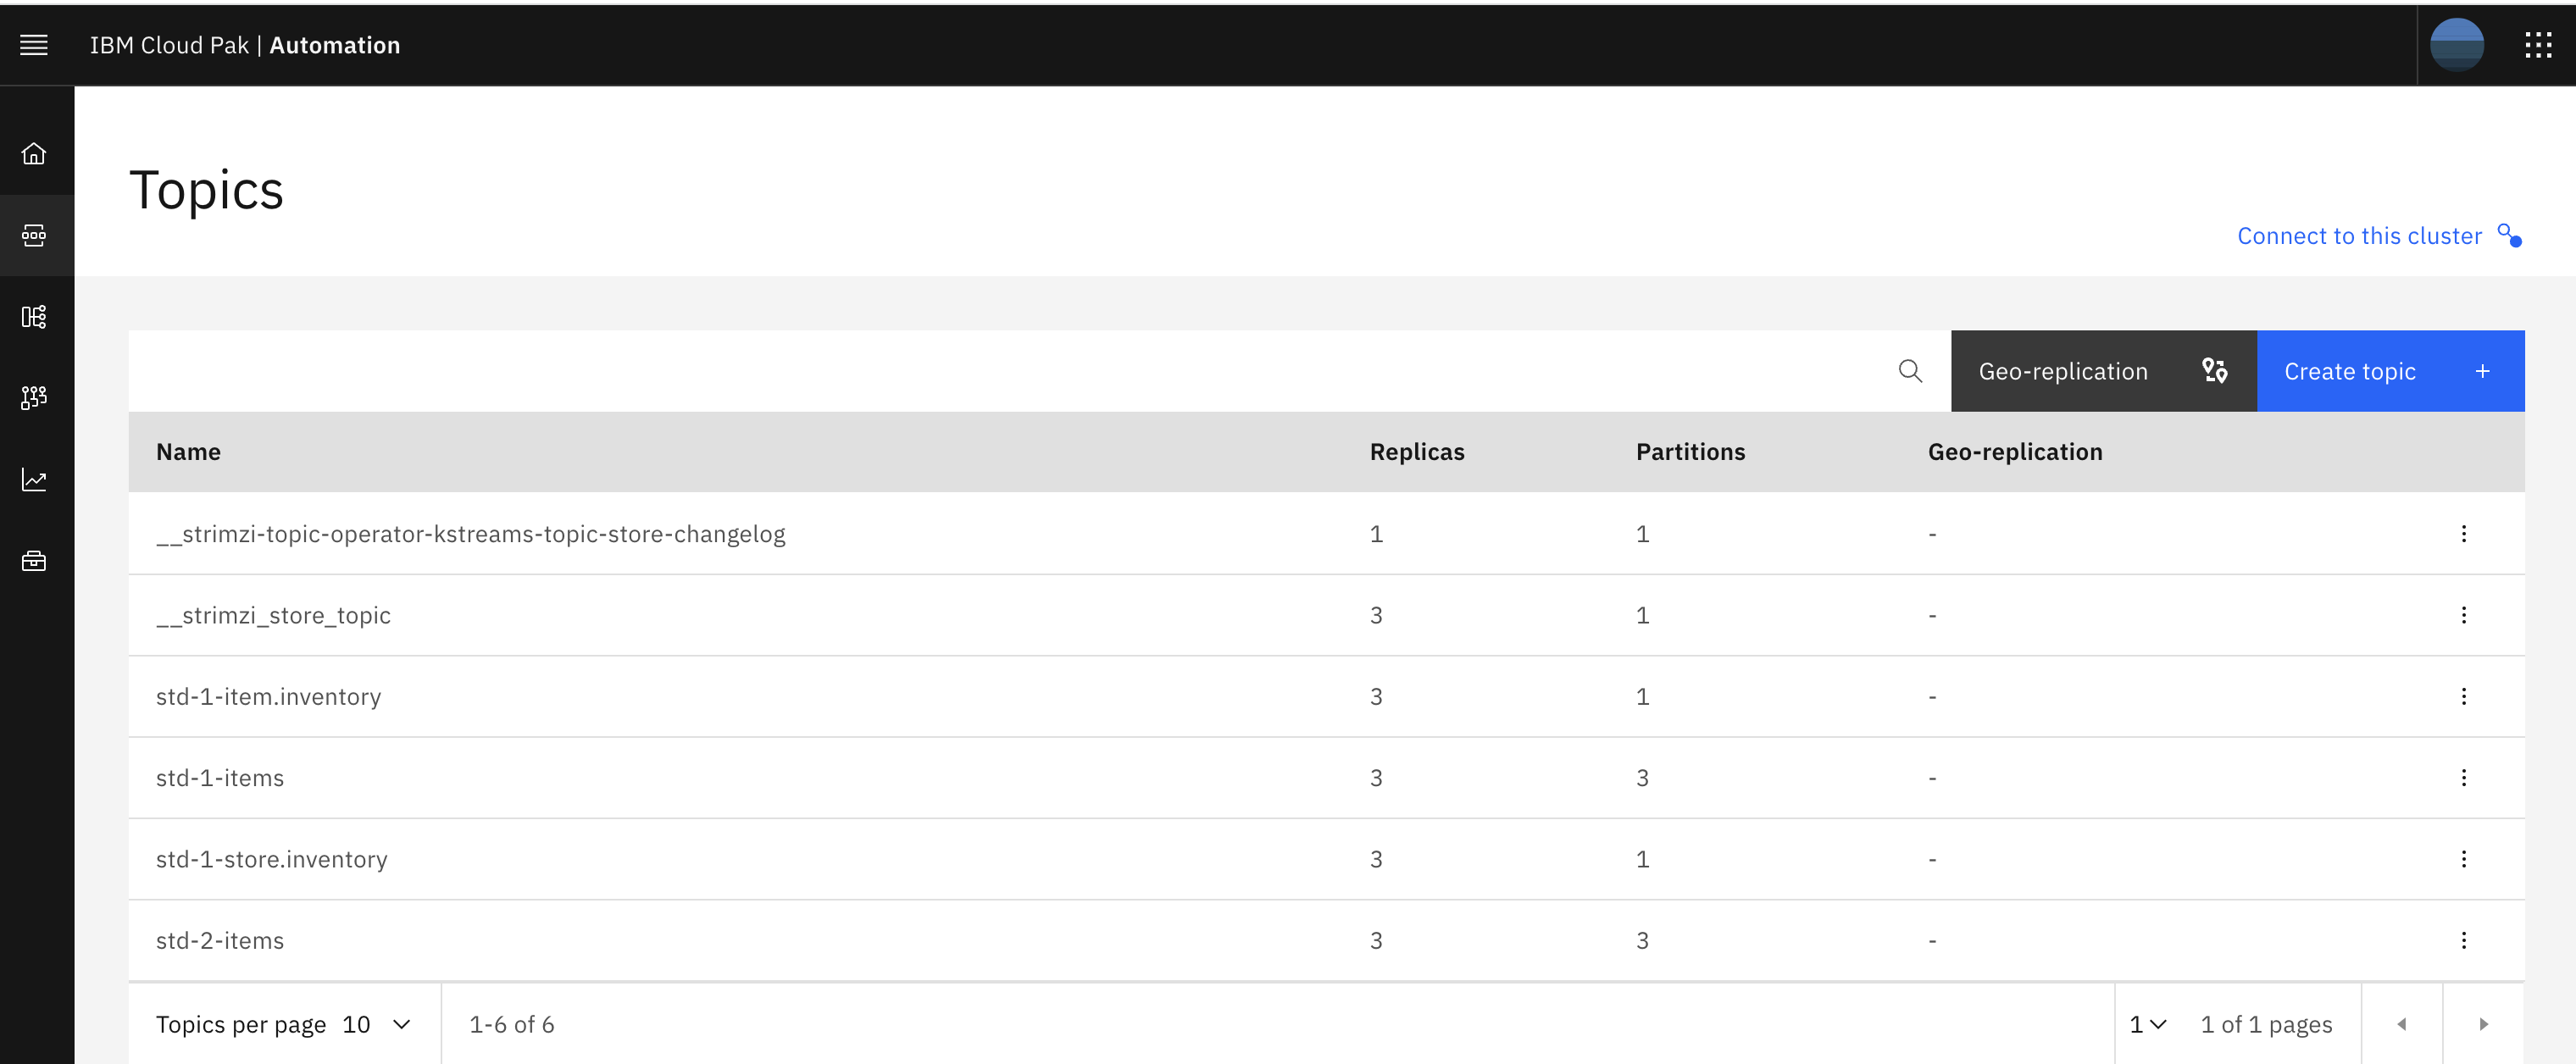
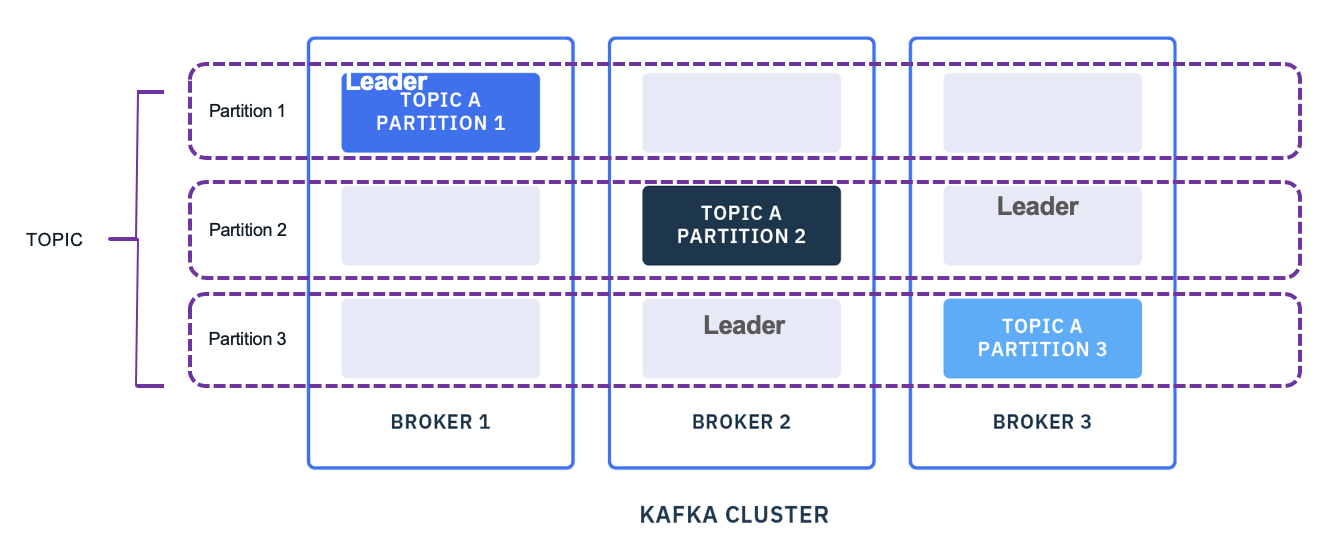
- replicas are to support record replication and to ensure high availability. Producer can wait to get acknowledgement of replication. Replicas needs to be set to 3 to supports 2 broker failures at the same time.
- partition defines the number of append logs managed by the broker. Each partition has a leader, and then follower brokers that replicate records from the leader. Partitions are really done to do parallel processing at the consumer level.
- The following diagram can be used to explain those concepts.
-
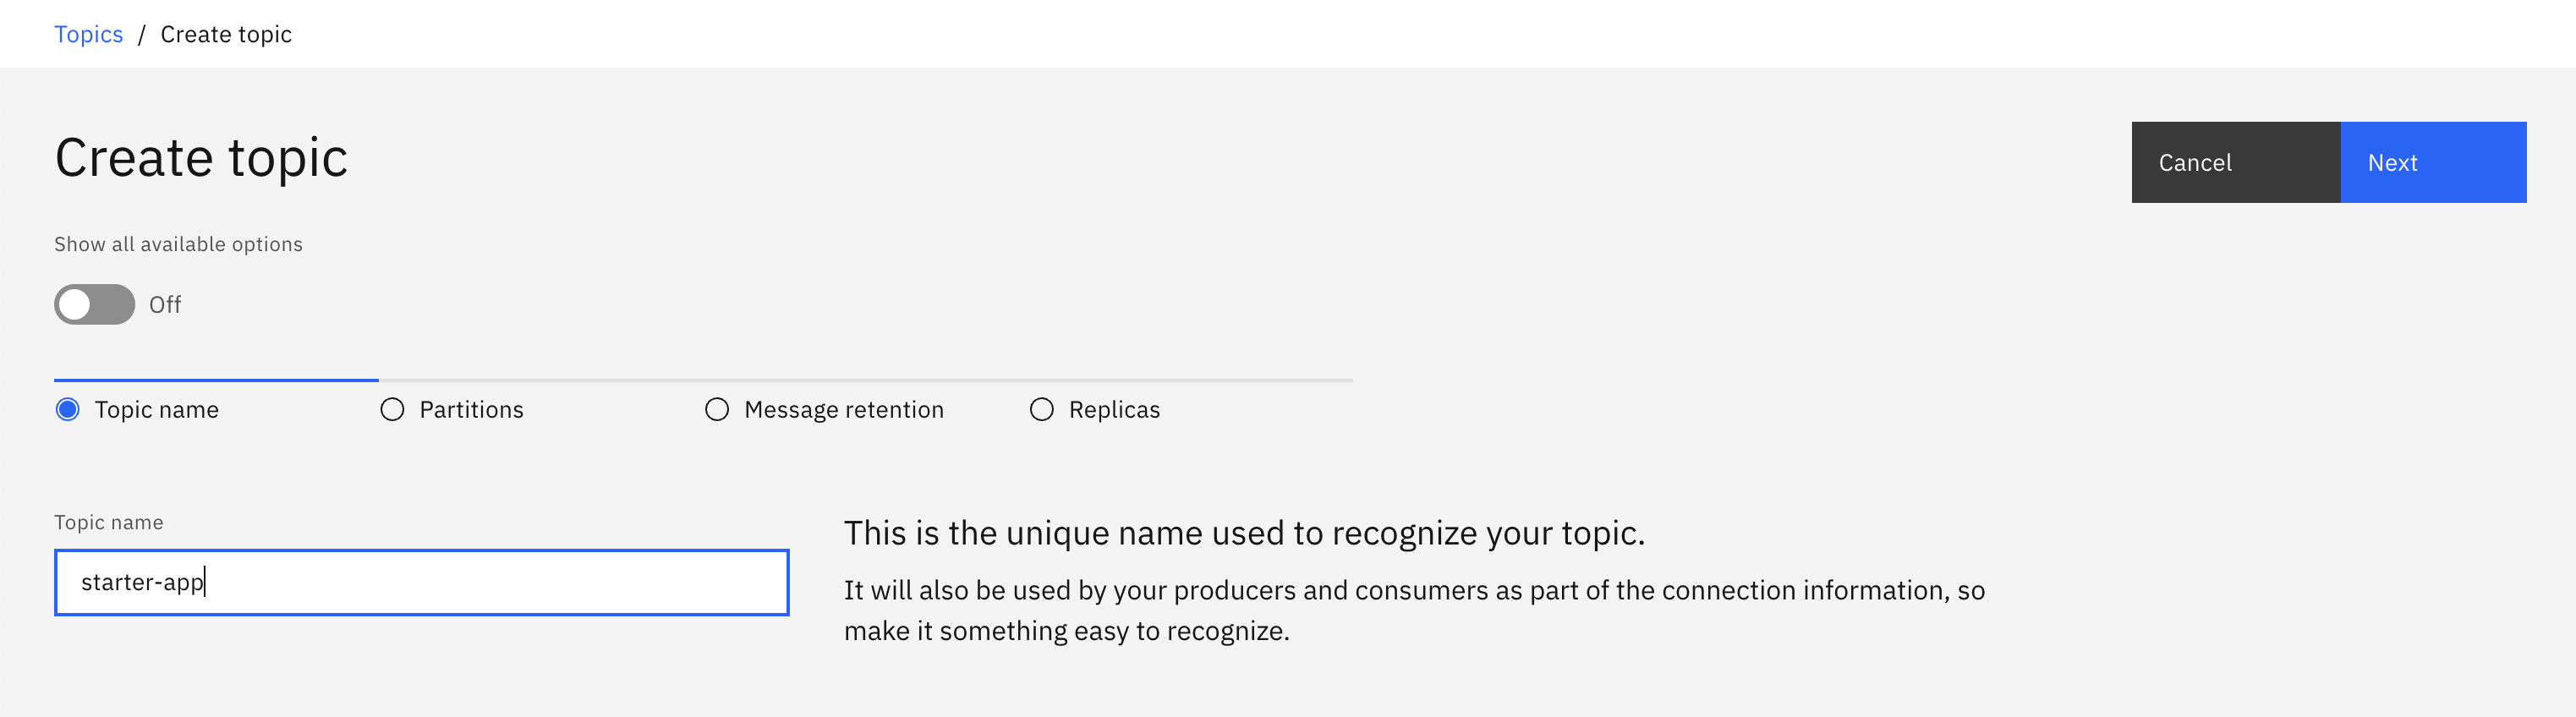
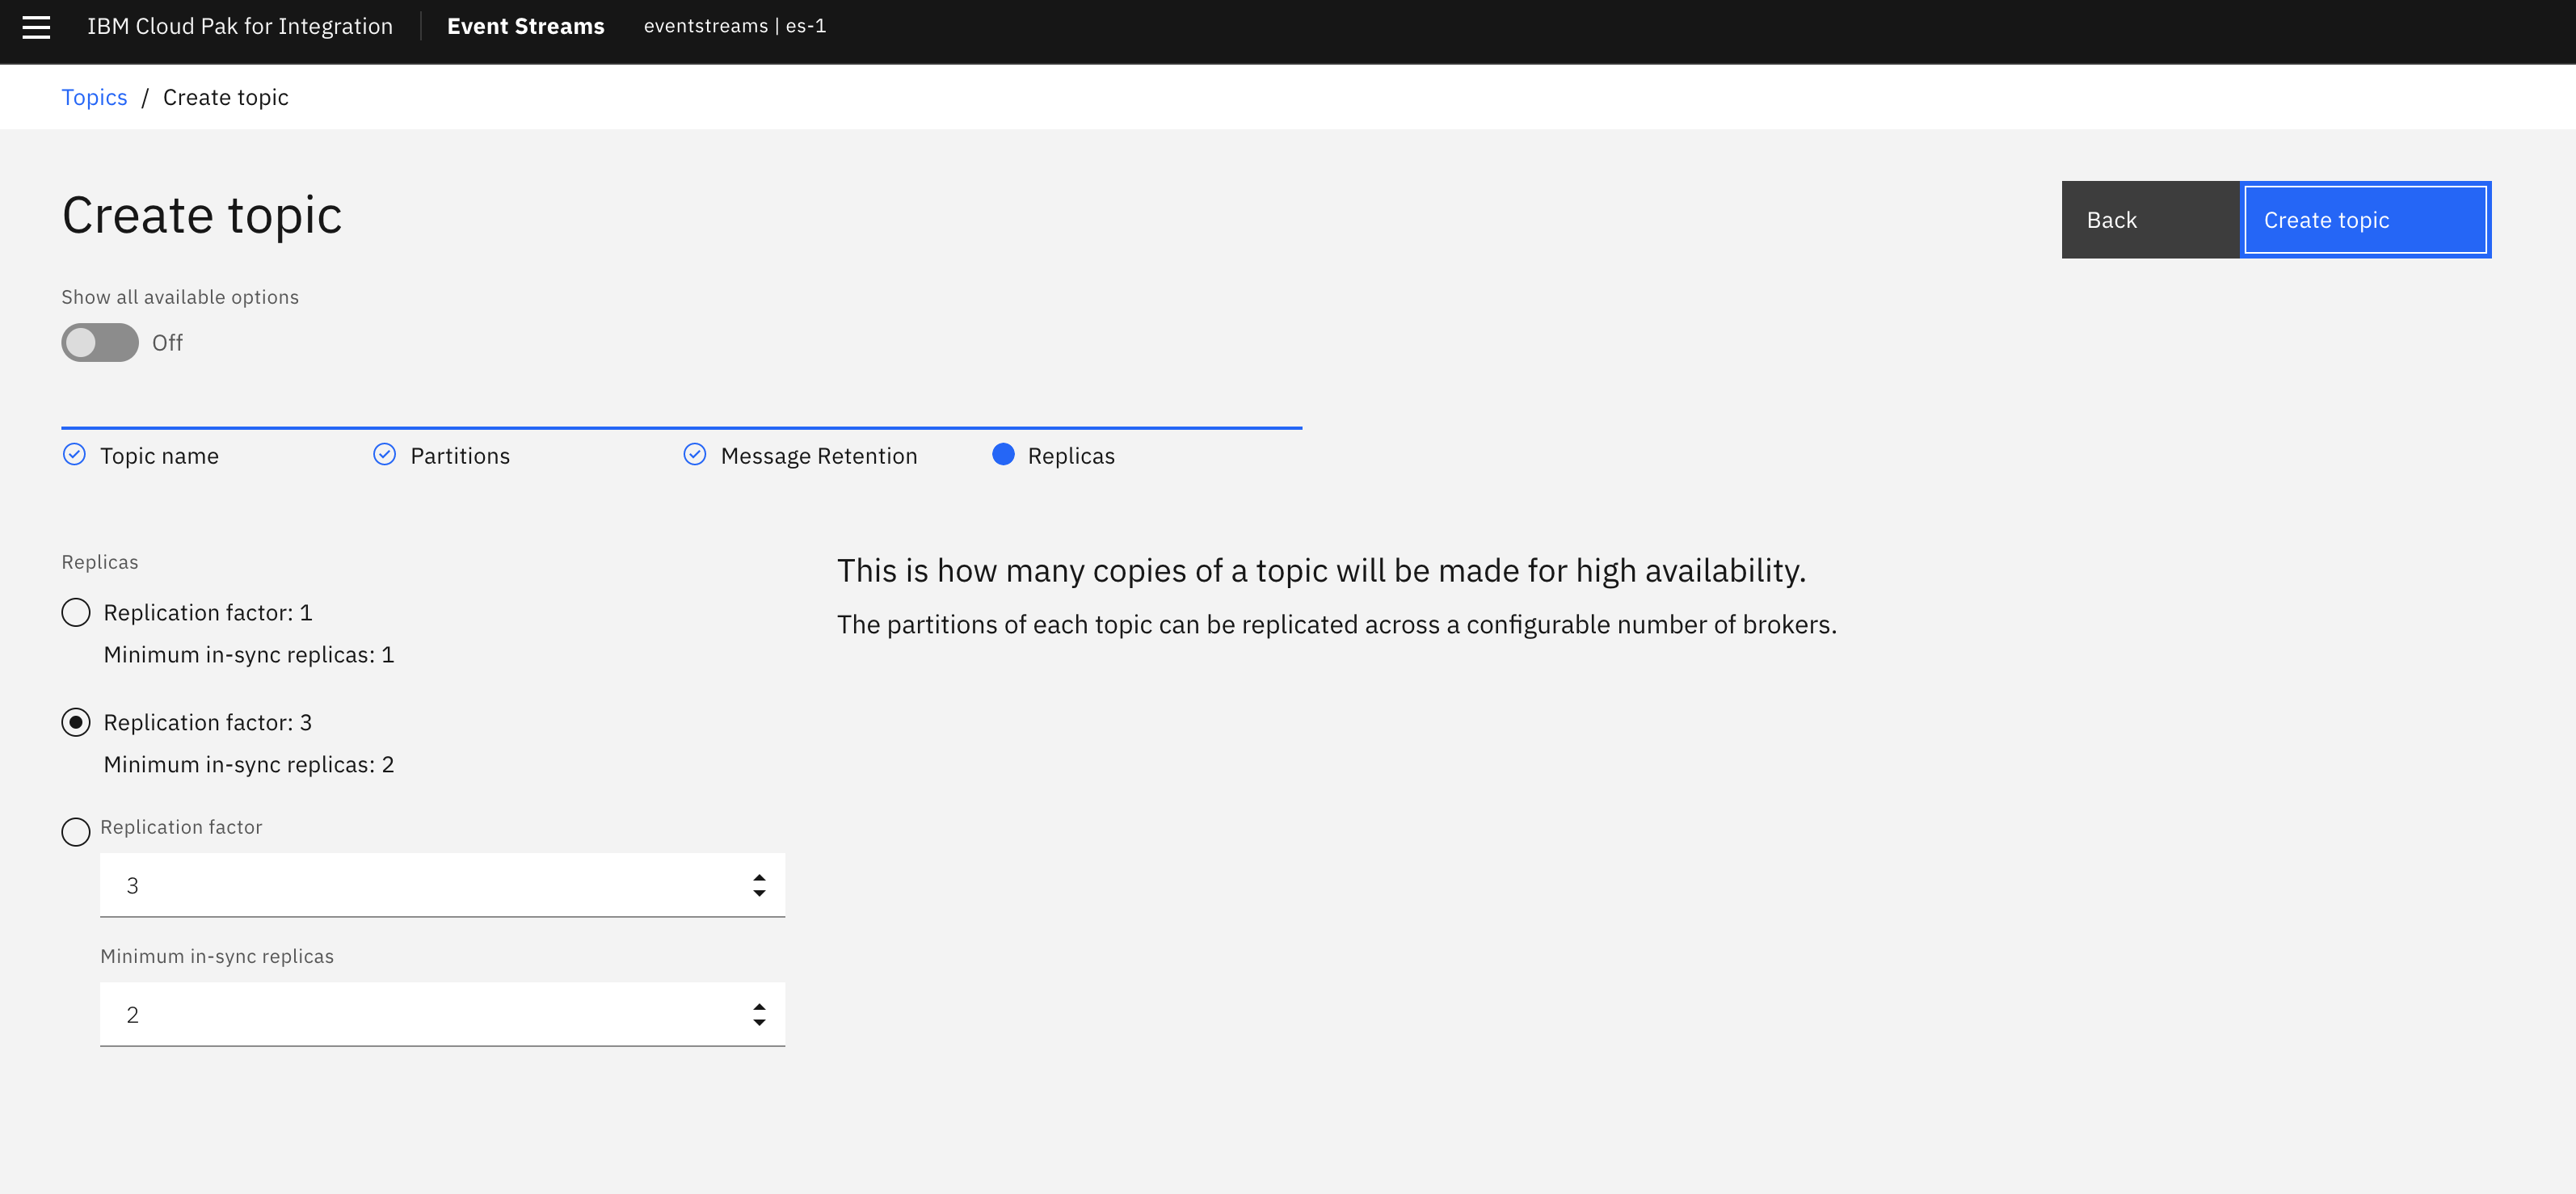
Create a topic for the Starter app, using the user interface:
Warning
When running on a multi-tenant Event Streams cluster you need to modify the name of the topic, to avoid conflicting with other topic name, use your userid as prefix.
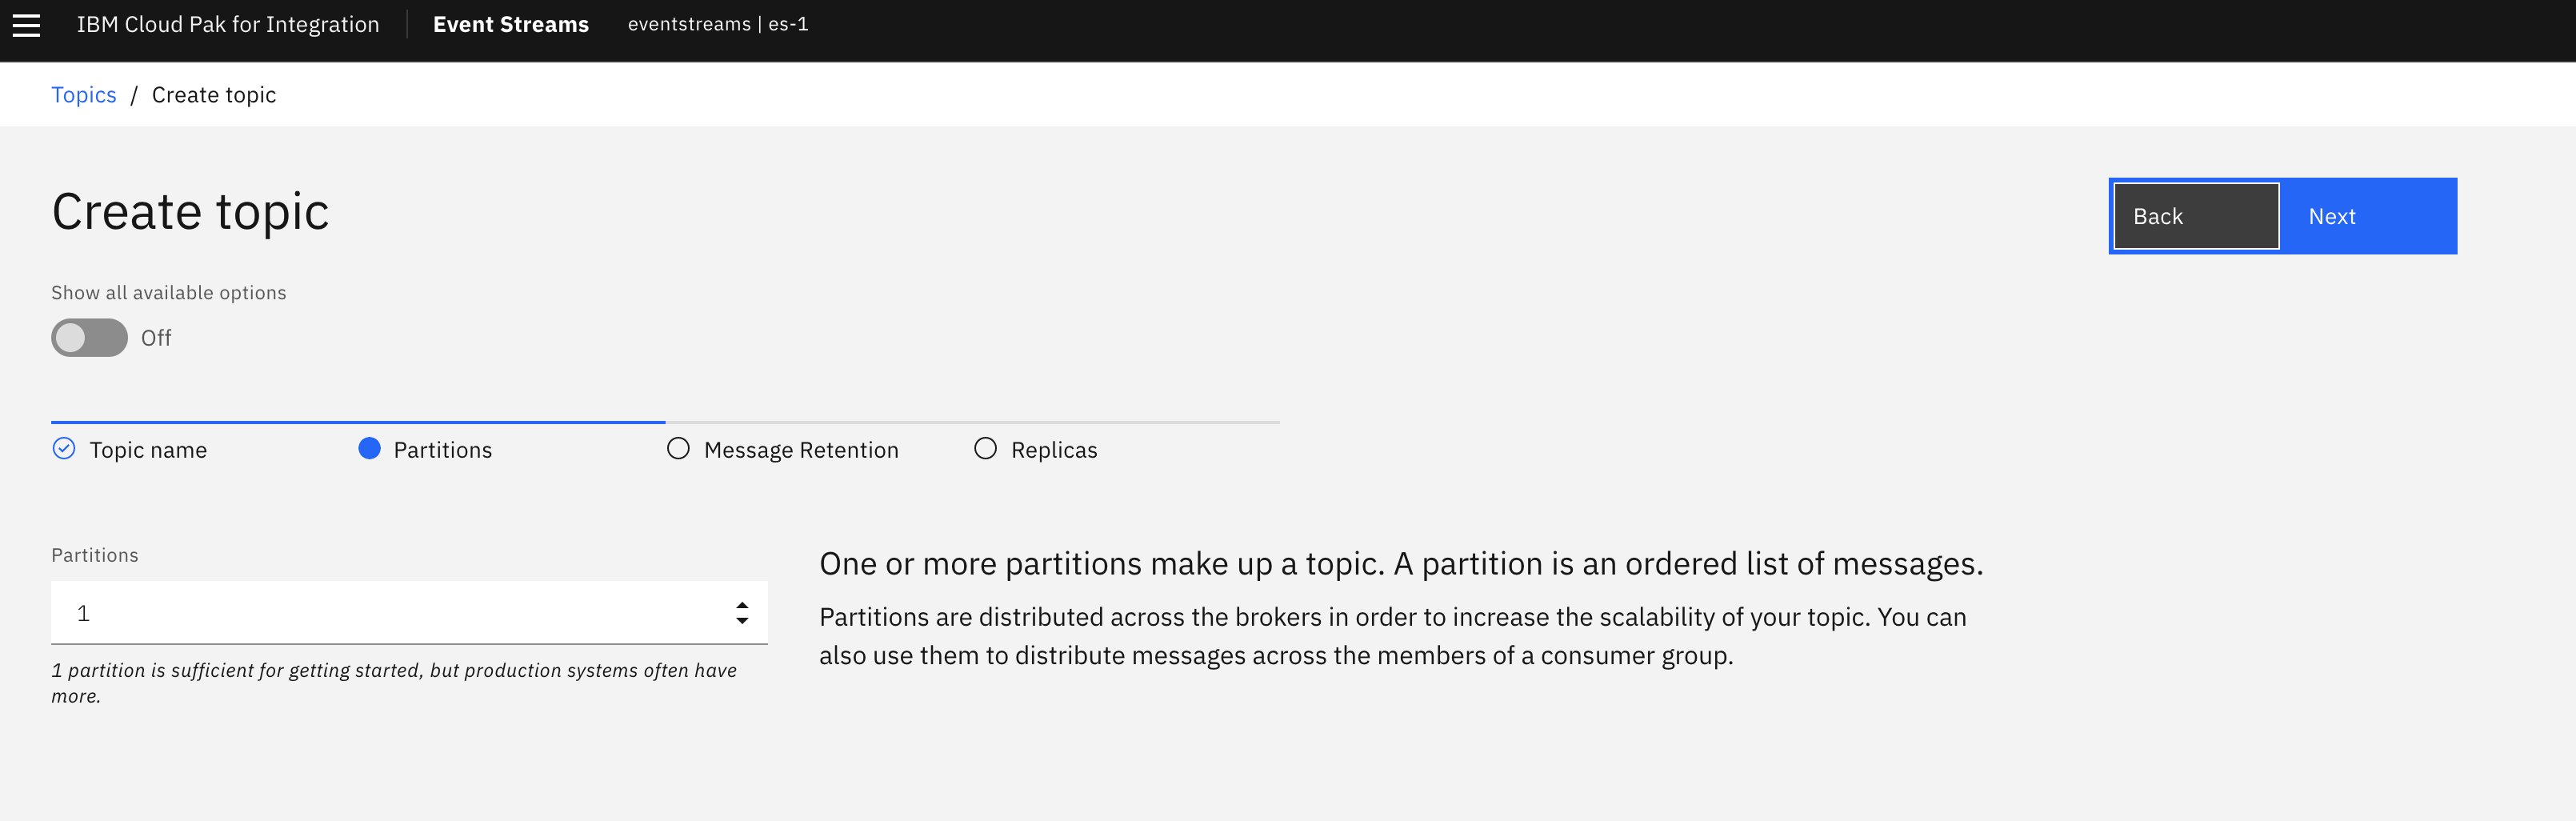
Use only one partition.
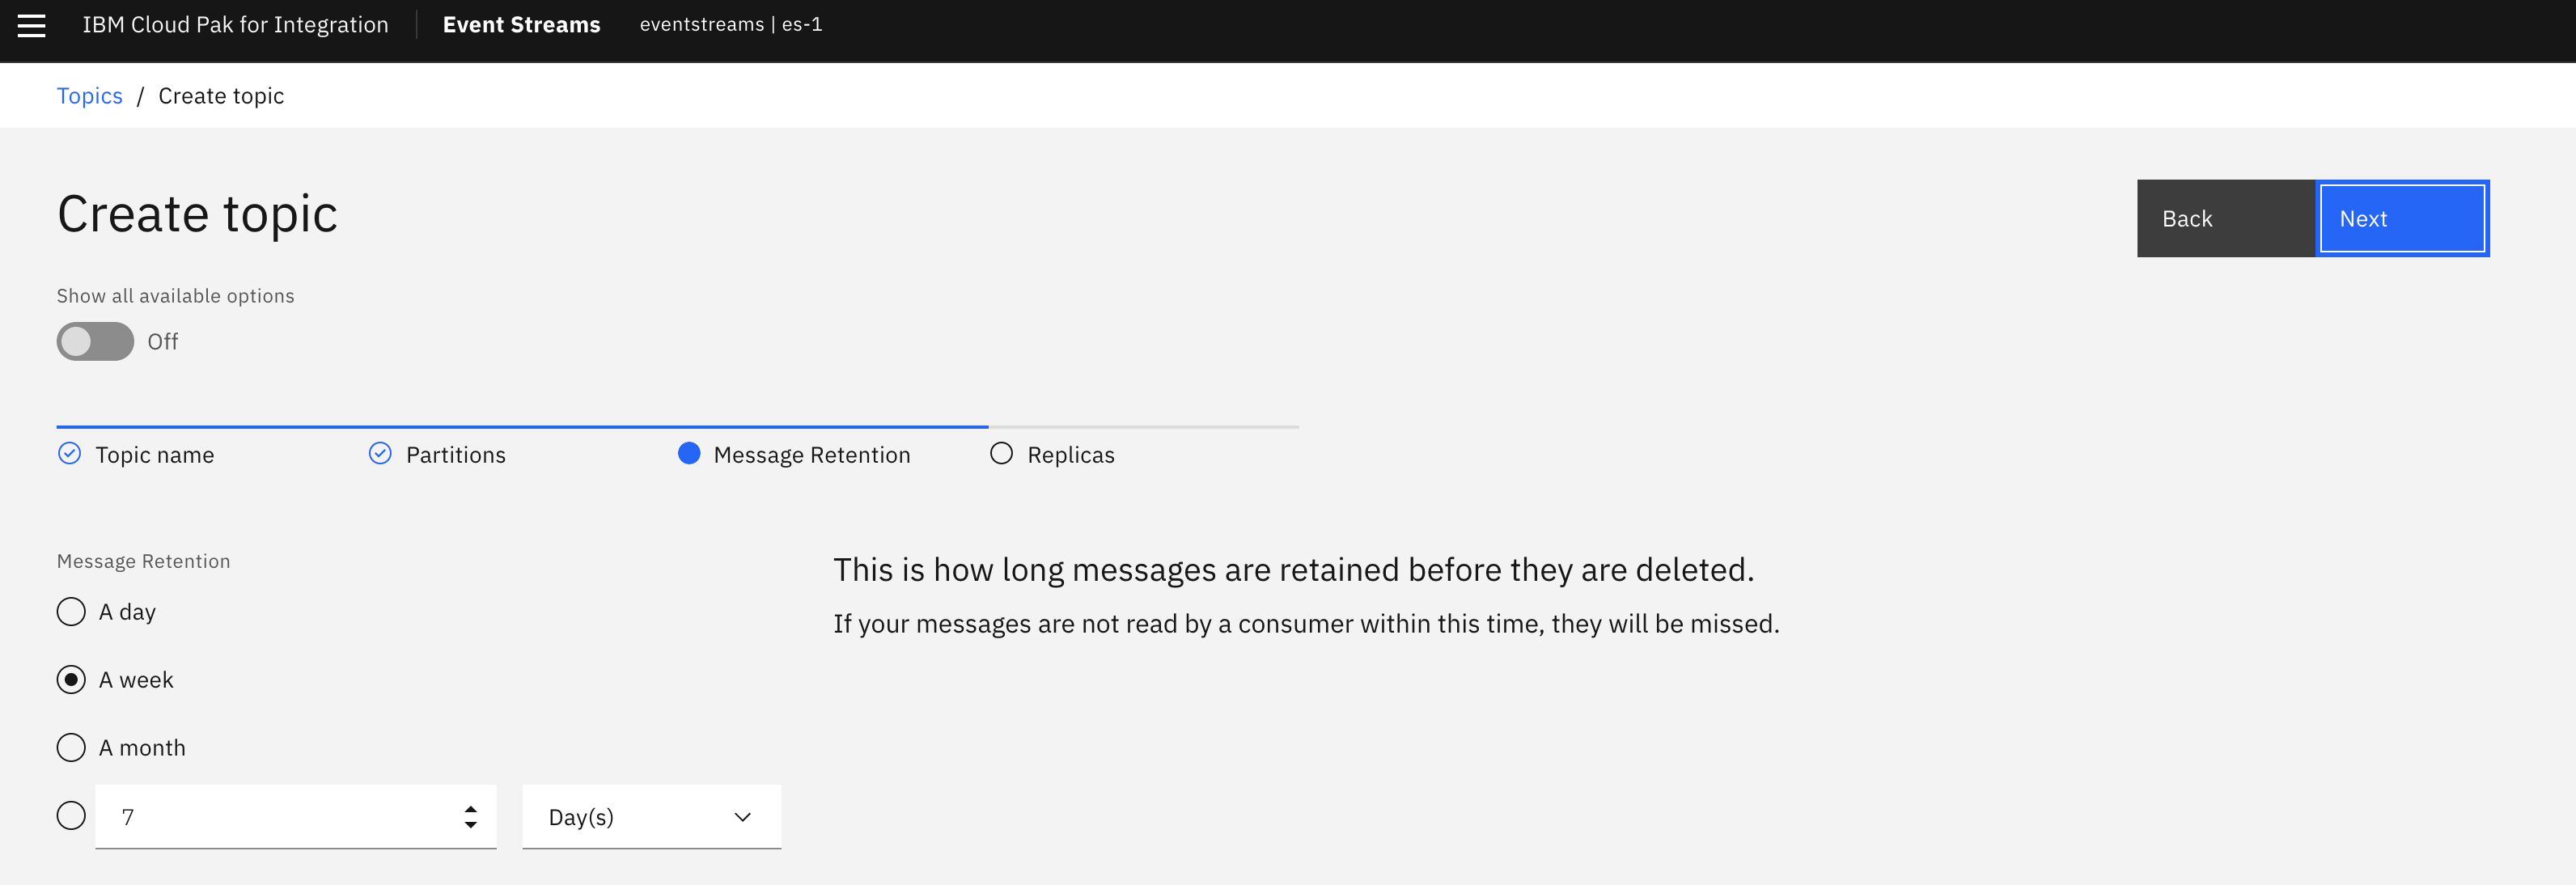
The default retention time is 7 days, Kafka is keeping data for a long time period, so any consumer applications can come and process messages at any time. It helps for microservice resilience and increase decoupling.
Finally the replicas for high availability. 3 is the production deployment, and in-sync replicas = 2, means producer get full acknowledge when there are 2 replicas done. Broker partition leader keeps information of in-sync replicas.
-
Just as an important note, topic may be created via yaml file or using CLI command. Go to the rt-inventory GitOps - es-topics.yaml and explain some of the parameters.
-
We will go over the process of adding new topic by using GitOps in this section
Read more
Run the Starter Application
See the beginned dedicated lab to get the application started, once done:
-
Go back to the Event Streams console, Topic management, and the
starter-apptopic, select theMessagestab and go to any messages. Explain that each messages has a timestamp, and an offset that is an increasing number. Offset are used by consumer to be able to replay from an older message, or when restarting from a failure. Offset management at the consumer application level is tricky, if needed you can have a deeper conversation on this topic later after the demonstration.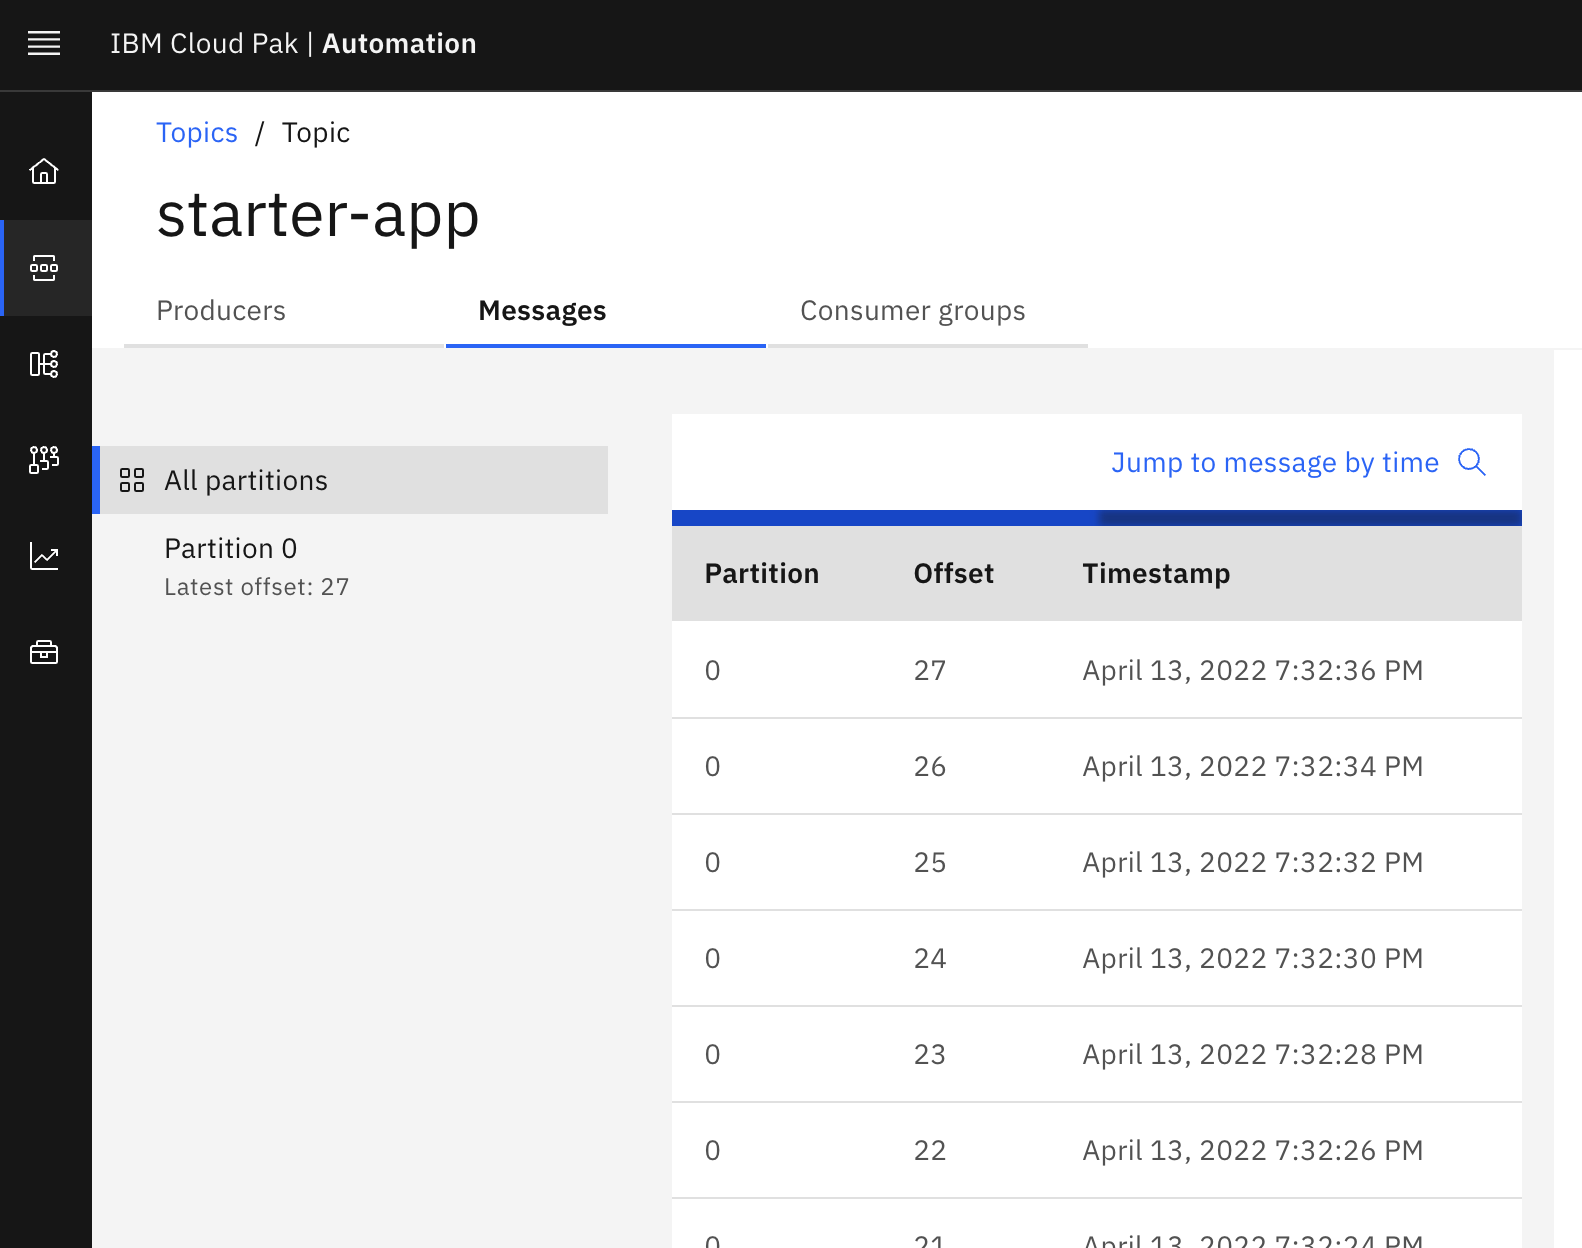
-
At the topic level, it is possible to see the consumer of the topic: Go to the
Consumer groupstab, to see who are the consumer, if the consumer is active or not (this will be controlled by the heartbeat exchanges when consumer poll records and commit their read offset).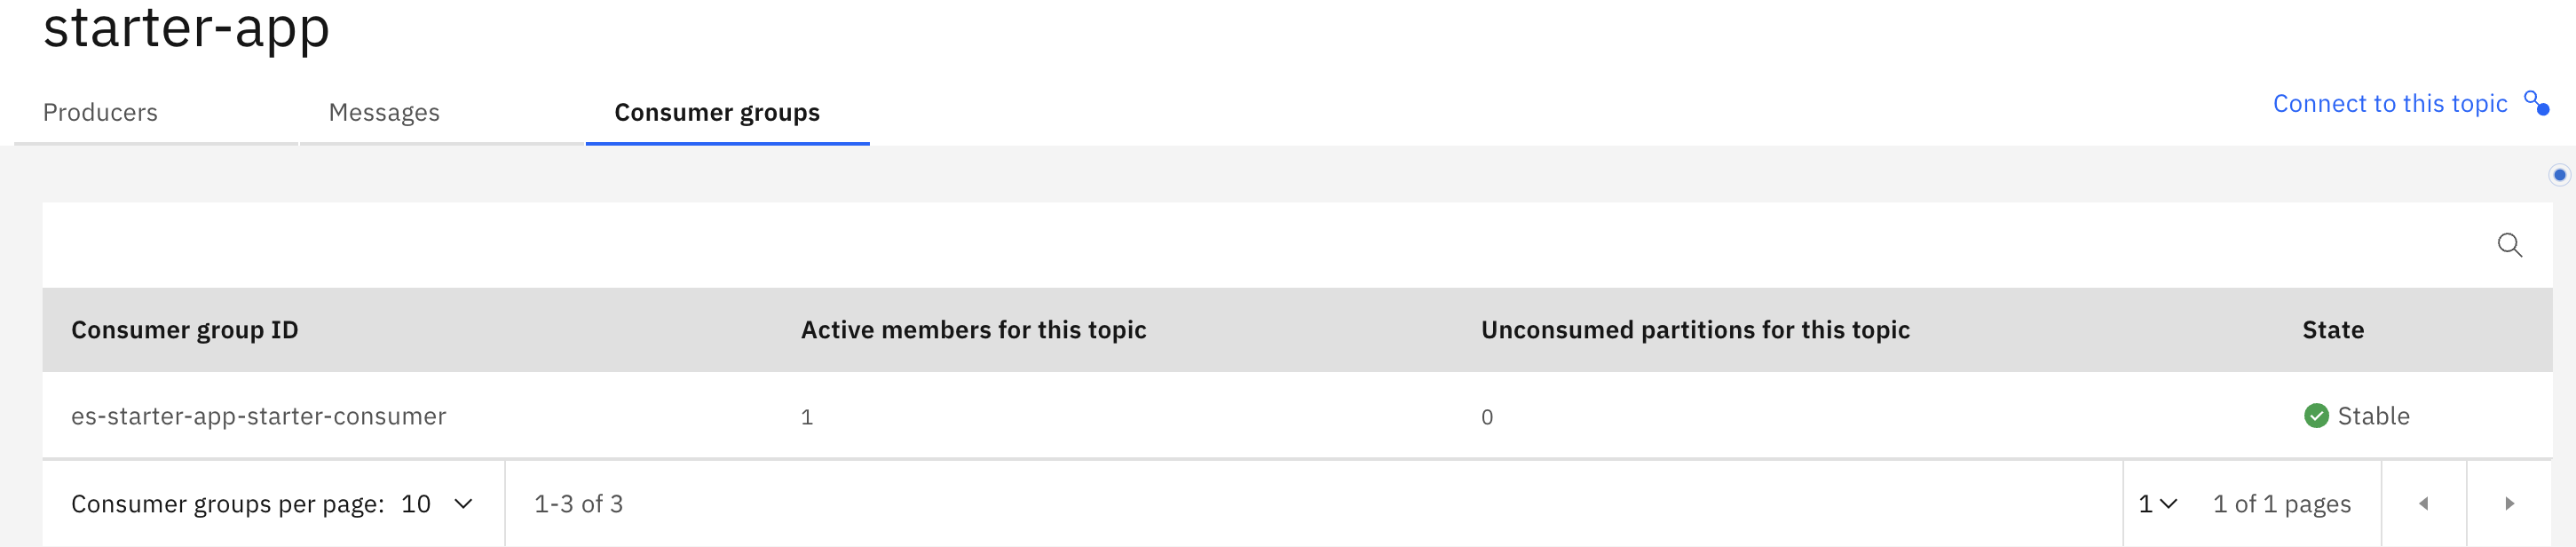
One important metric in this table is the unconsumed partition value. If the number of partitions is more than 1 and there are less than the number of consumer than of partition, then it means a consumer is processing two or more partitions.
-
Going by to the starter application, you can start consuming the records. This is to demonstrate that consumer can connect at anytime, and that it will quickly consume all messages. Stopping and restarting is also demonstrating that consumer, continues from the last read offset.
There is an alternate of running this application on your laptop, it can be deployed directly to the same OpenShift cluster, we have defined deployment and config map to do so.
Deploy starter app on OpenShift
- Use the same
kafka.propertiesandtruststore.p12files you have downloaded with the starter application to create two kubernetes secrets holding these files in your OpenShift cluster
oc create secret generic demo-app-secret --from-file=./kafka.properties
oc create secret generic truststore-cert --from-file=./truststore.p12
- Clone the following GitHub repo that contains the Kubernetes artifacts that will run the starter application.
- Change directory to where those Kubernetes artefacts are.
- Deploy the Kubernetes artefacts.
- Get the route to the starter application running on your OpenShift cluster.
- Point your browser to that url to work with the IBM Event Streams Starter Application.
Back to the Cluster configuration
Event Streams cluster can be configured with Yaml and you can review the following cluster definition to explain some of the major properties: EDA GitOps Catalog - example of production cluster.yaml:
| Property | Description |
|---|---|
| Replicas | specify the # of brokers or zookeeper |
| Resources | CPU or mem requested and limit |
| Listeners | Define how to access the cluster: External with scram authentication and TLS encryption, and internal using TLS authentication or PLAIN. |
| Entity operators | Enable topic and user to be managed by operator |
| Rack awareness | To use zone attribute from node to allocate brokers in different AZ |
| Cruise Control | Open source for cluster rebalancing |
| Metrics | To export different Kafka metrics to Prometheus via JMX exporter |
For Kafka, the following aspects of a deployment can impact the resources you need:
- Throughput and size of messages
- The number of network threads handling messages
- The number of producers and consumers
- The number of topics and partitions
Producing messages
The product documentation - producing message section goes into details of the concepts. For a demonstration purpose, you need to illustrate that you can have multiple types of Kafka producer:
- Existing Queuing apps, which are using IBM MQ, and get their messages transparently sent to Event Streams, using IBM MQ Streaming Queue and MQ Source Kafka Connector.
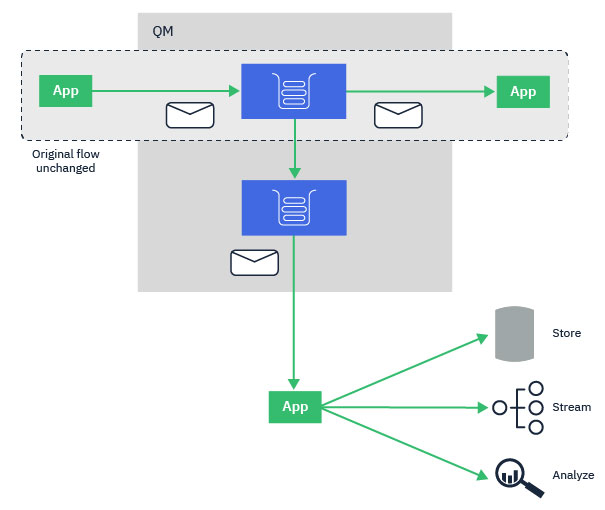
- Microservice applications publishing events using Kafka producer API, or reactive messaging in Java Microprofile. For Nodejs, Python there is a C library which supports the Kafka APIs. We have code template for that.
- Change data capture product, like Debezium, that gets database updates and maps records to events in topic. One topic per table. Some data transformation can be done on the fly.
- Streaming applications, that do stateful computing, real-time analytics, consuming - processing - publishing events from one to many topics and produce to one topic.
- App connect flow can also being source for events to Events Streams, via connectors.
The following diagram illustrates those event producers.
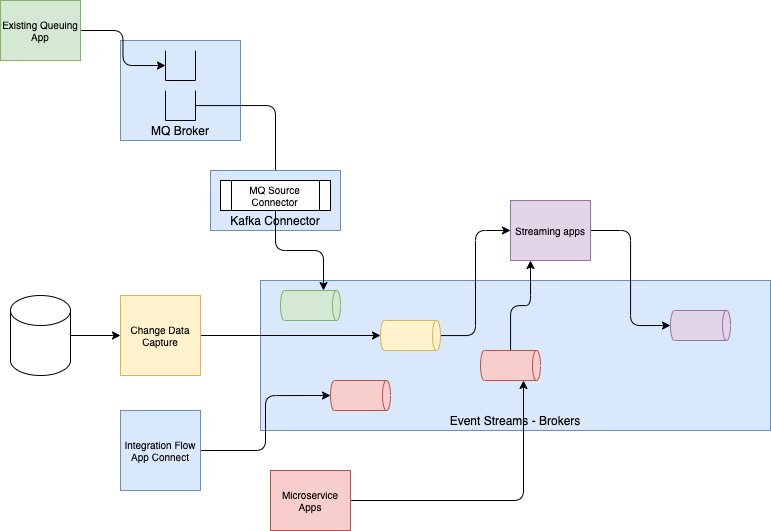
Each producer needs to get a URL to the broker, defines the protocol to authenticate, and gets server side TLS certificate, the topic name, and that's it to start sending messages.
For production deployment, event structures are well defined and schema are used to ensure consumer can understand how to read messages from the topic/partition. Event Streams offers a schema registry to manage those schema definitions.
You can introduce the schema processing with the figure below:
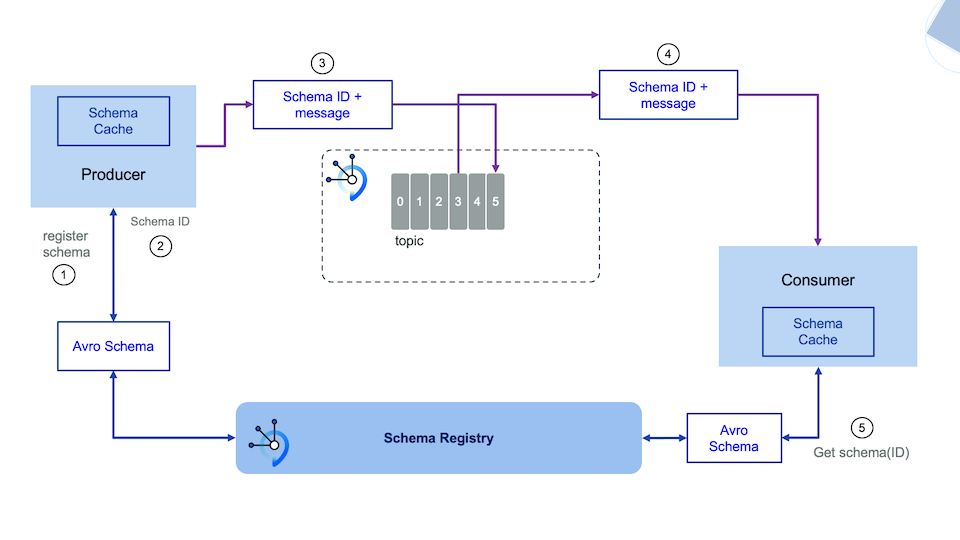
Schema flow explanations
- (1) Avro or Json schemas are defined in the context of a producer application. As an example you can use the OrderEvent.avsc in the EDA quickstart project.
- They are uploaded to Schema registry, you will demonstrate that in 2 minutes
- (2) Producer application uses Serializer that get schema ID from the registry
- (3) Message includes metadata about the schema ID
- (4) So each message in a topic/partition may have a different schema ID, which help consumer to be able to process old messages
- (5) Consumers get message definitions from the central schema registry.
Schema registry
This is really an introduction to the schema management, a deeper demo will take around 35 minutes and is described in this EDA lab
-
Get the ItemEvent schema definition (Defined in the context of the real-time inventory demo) using the command below:
curl https://raw.githubusercontent.com/ibm-cloud-architecture/refarch-eda-store-simulator/master/backend/src/main/avro/ItemEvent.avsc > ItemEvent.avscWarning
When running on a multi-tenant Event Streams cluster you need to modify the name of the schema name, to avoid conflicting with other schema name in the registry. In the context of the
IBM Tech Academy, we propose you prefix the name with your assigned user-id. -
Go to the Schema registry in the Event Streams console, and click to
Add Schema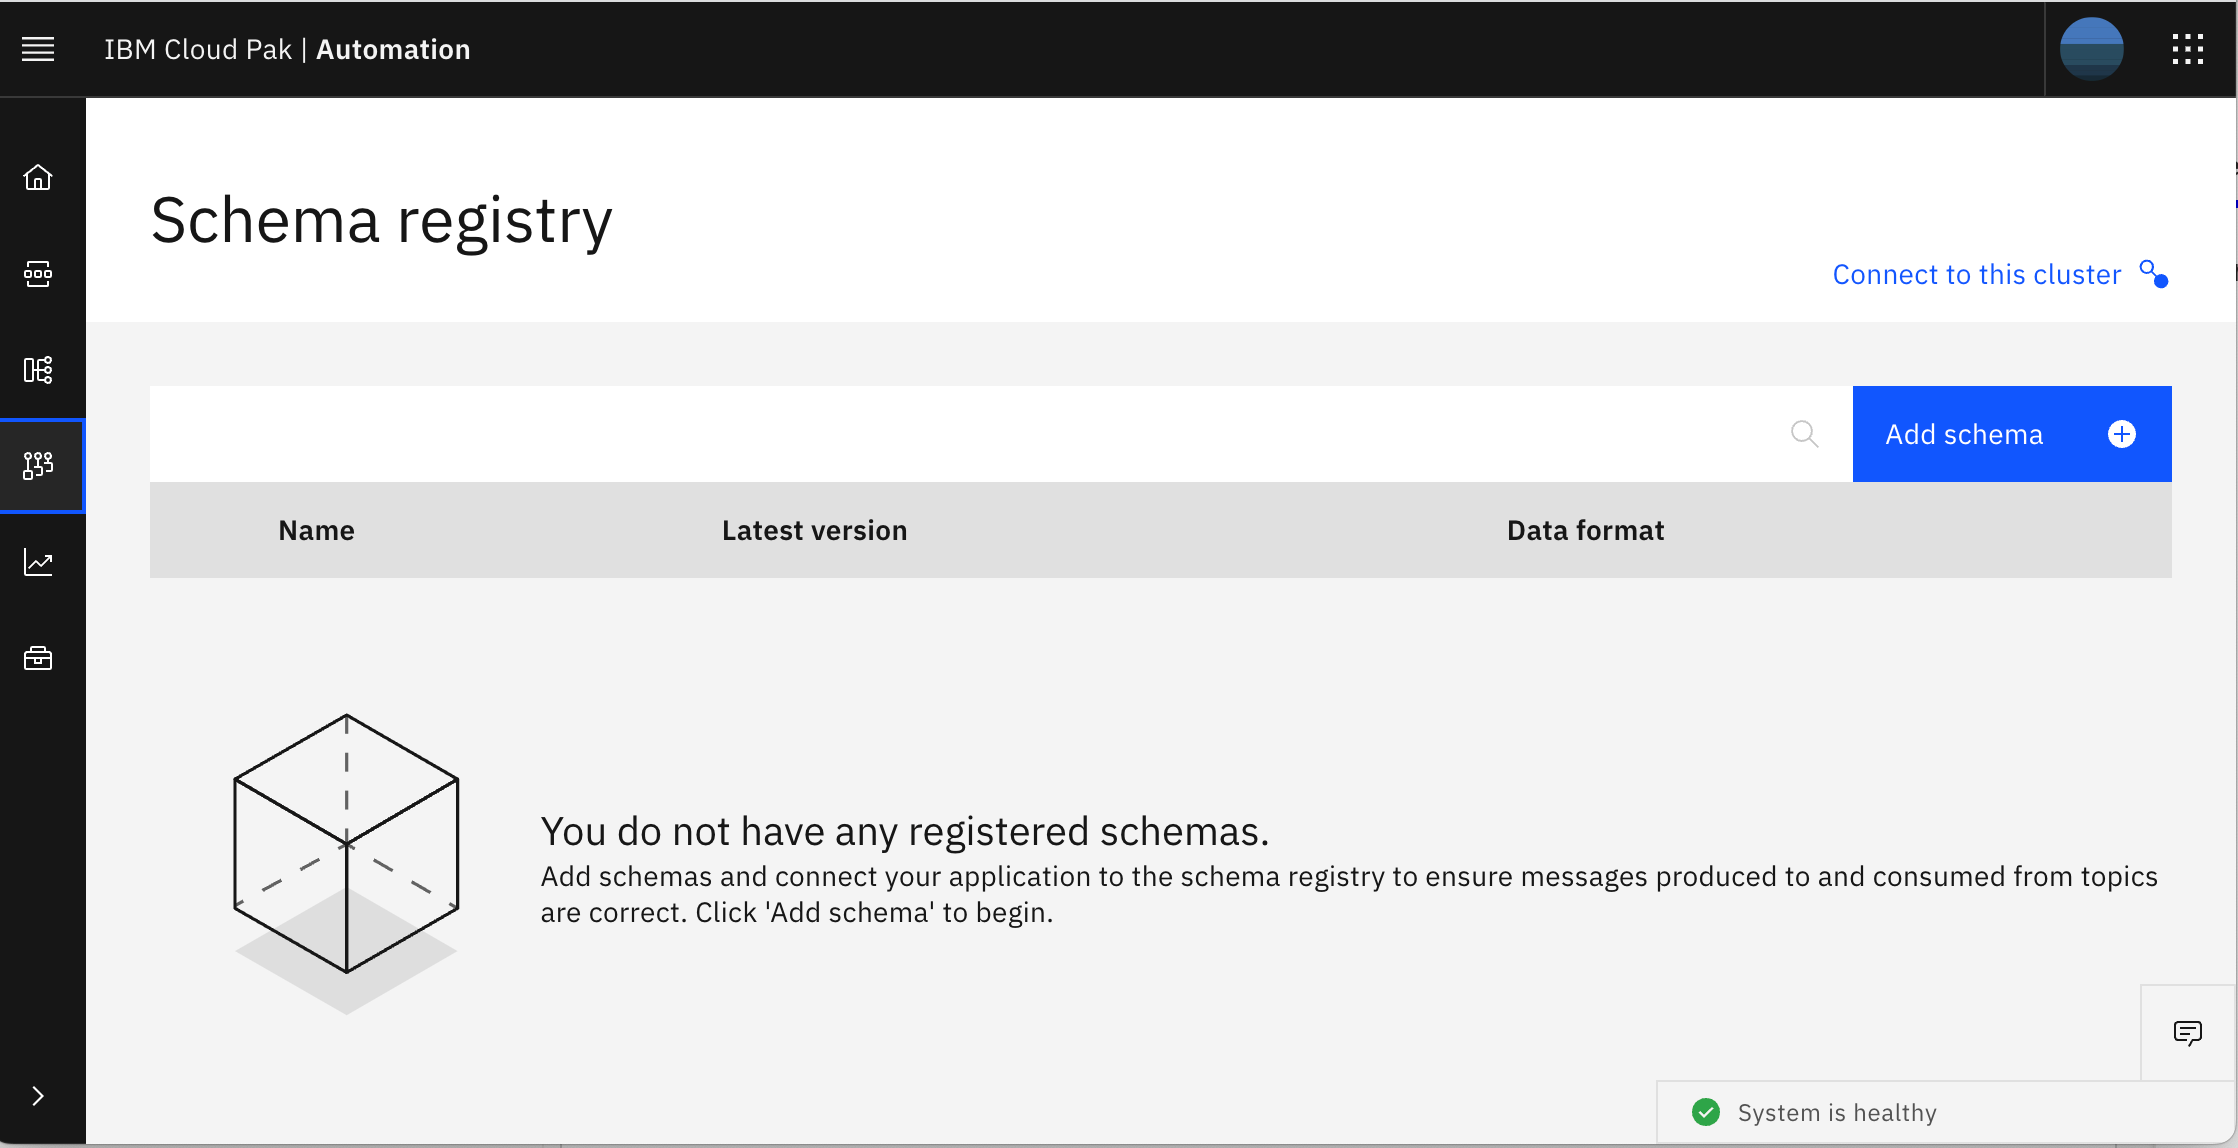
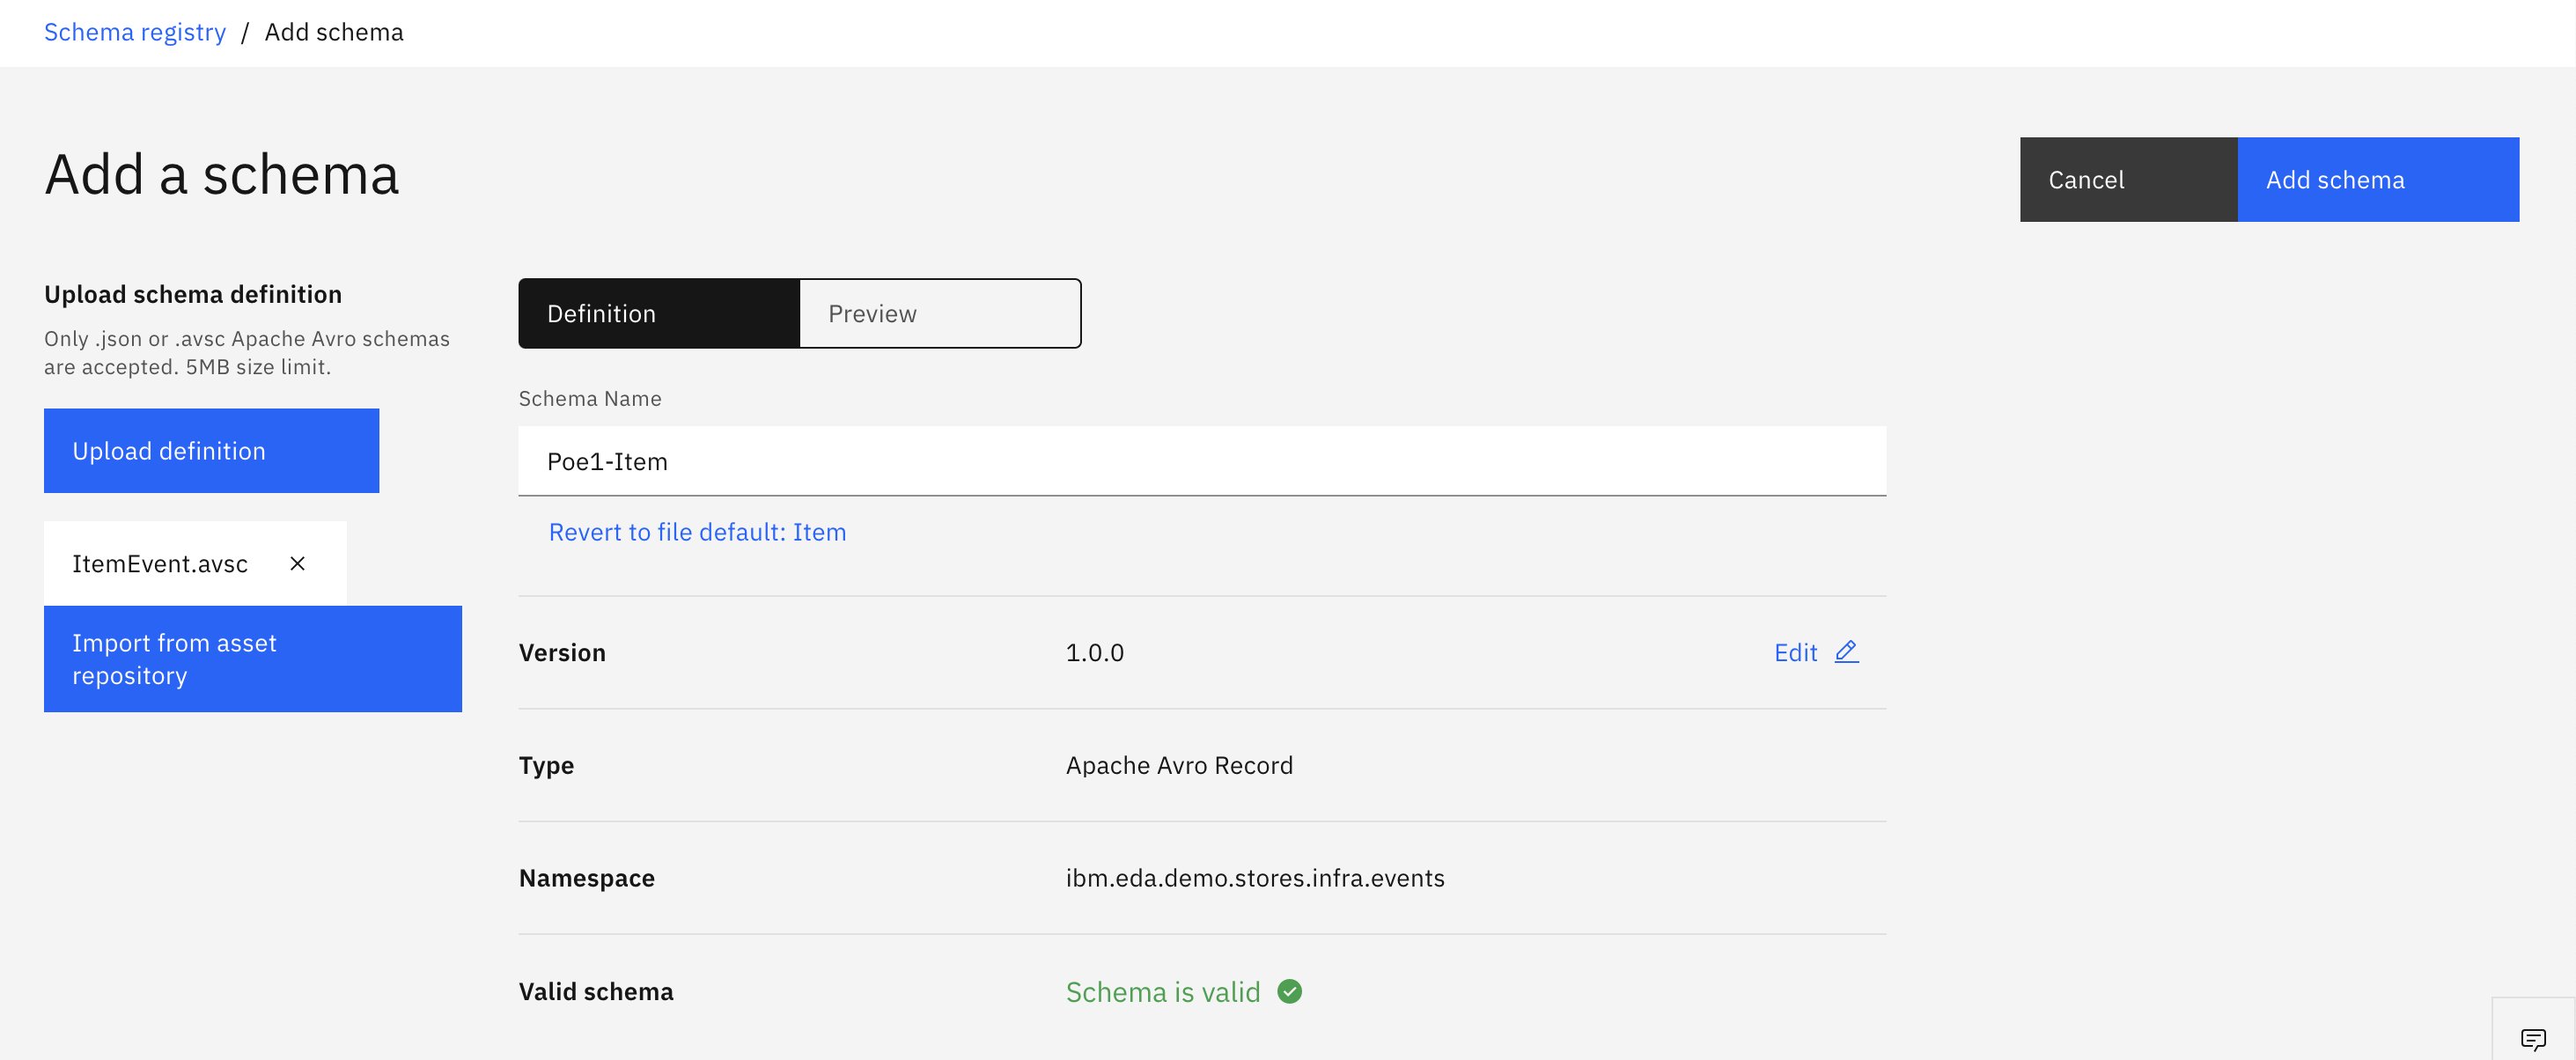
-
In the
Add schemaview, selectUpload definition, select theItemEvent.avsc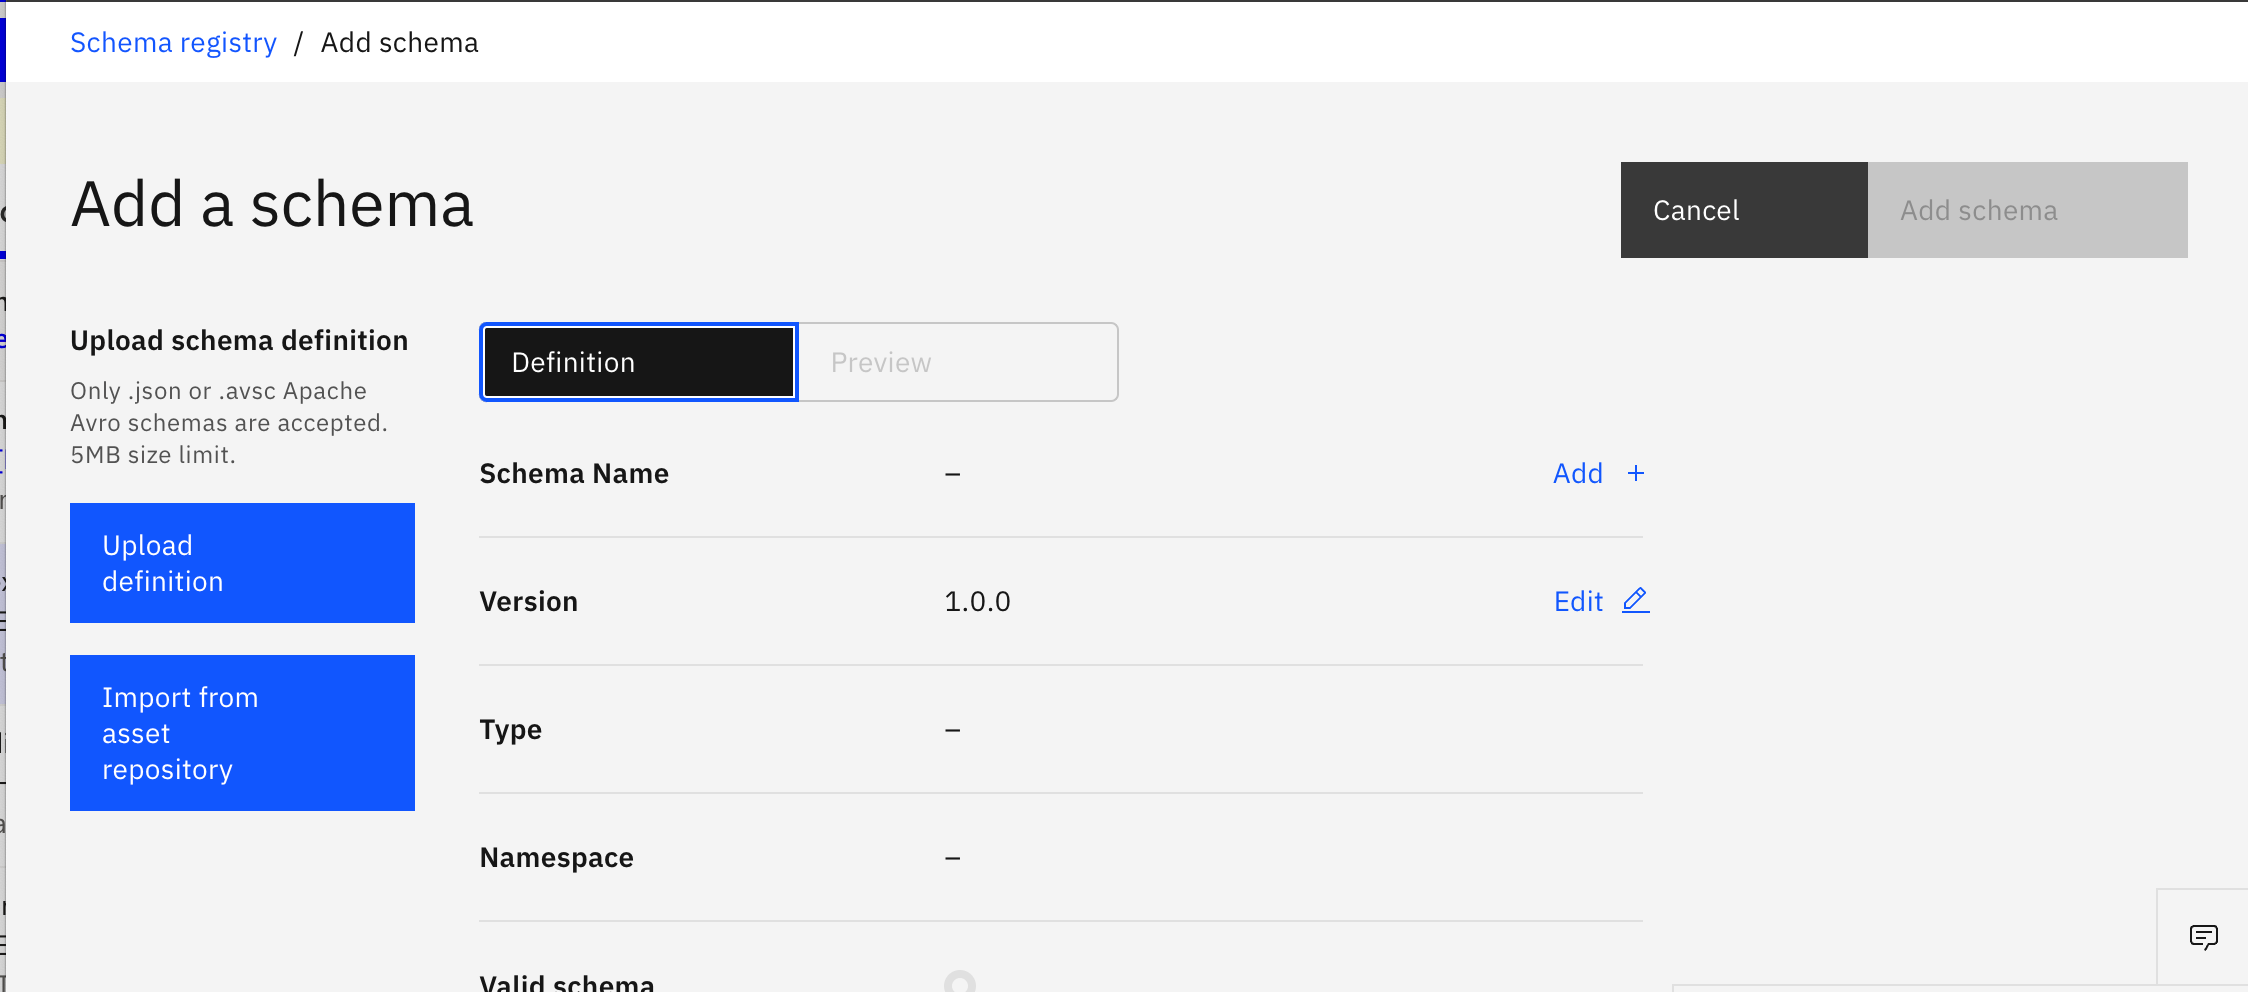
-
The first ItemEvent schema is validated,
-
You can see its definition too
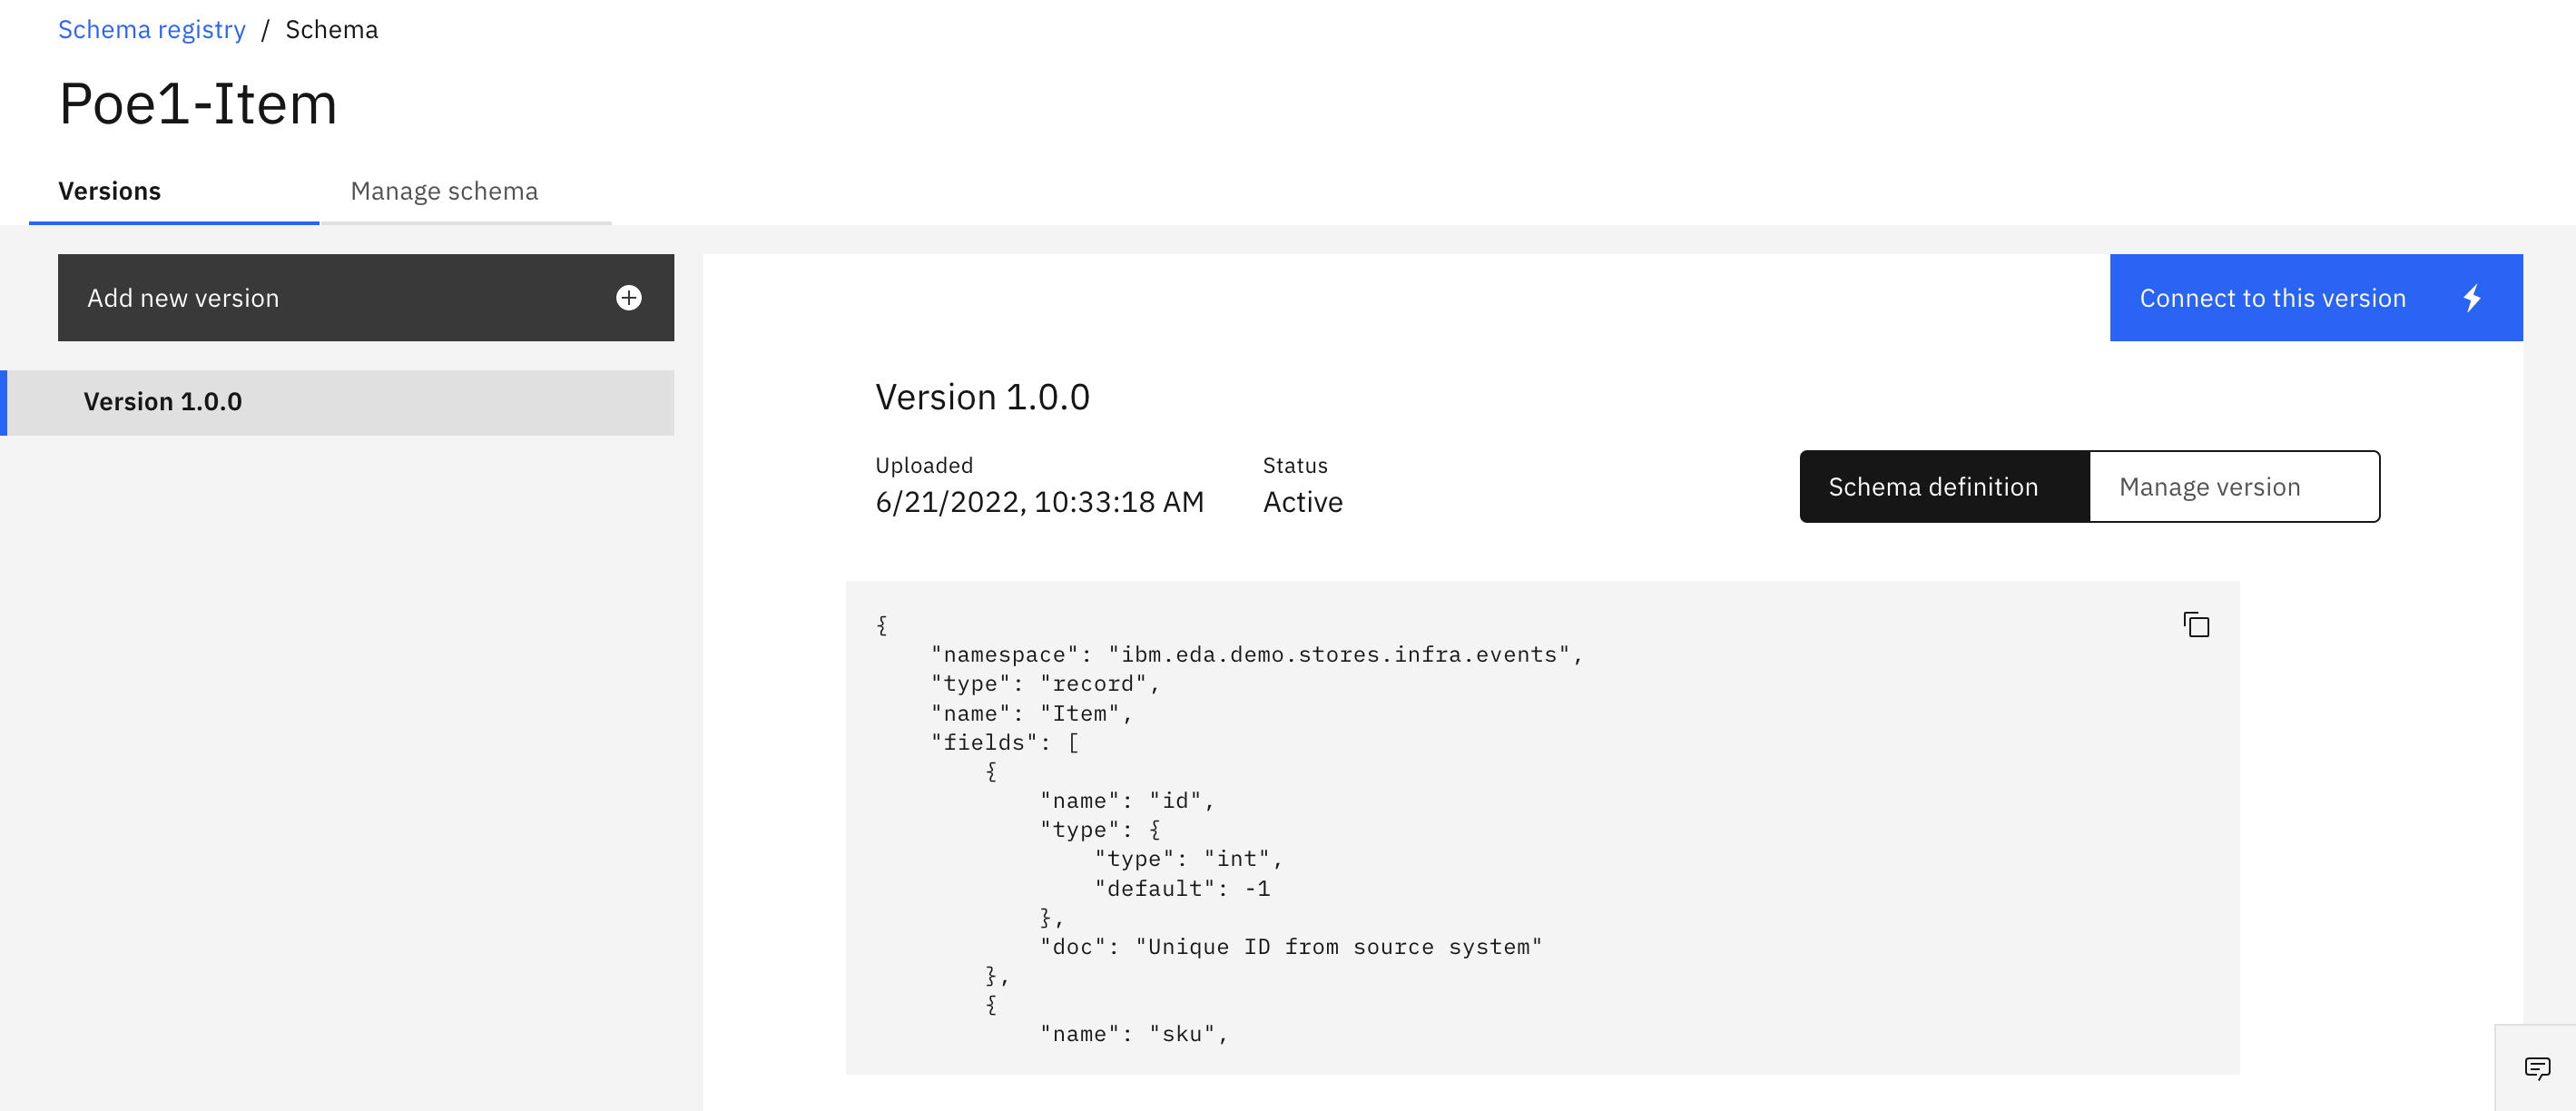
-
Do not forget to press
Add schemato save your work. Now the schema is visible in the registry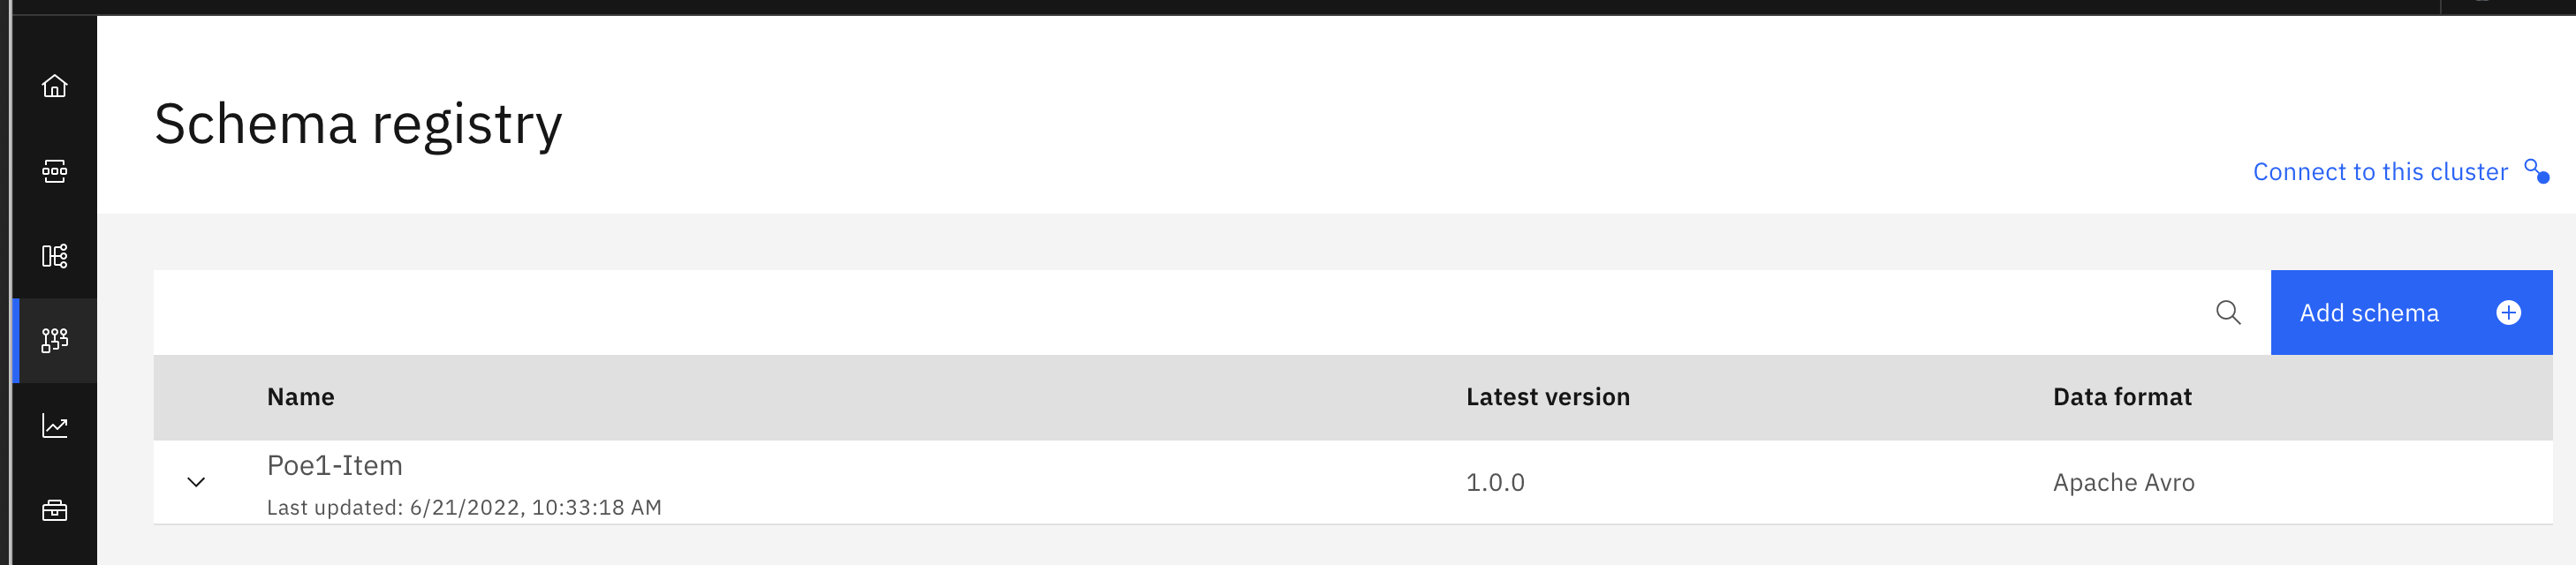
Now any future producer application discussions should be around level of control of the exactly once, at most once delivery, failover and back preasure. This is more complex discussion, what is important to say is that we can enforce producer to be sure records are replicated before continuing, we can enforce avoiding record duplication, producer can do message buffering and send in batch, so a lot of controls are available depending of the application needs.
Reading more
Consumer application - consumer group
Let’s take a look at consumer group and how consumer gets data from Topic/partition. The following figure will help supporting the discussion:
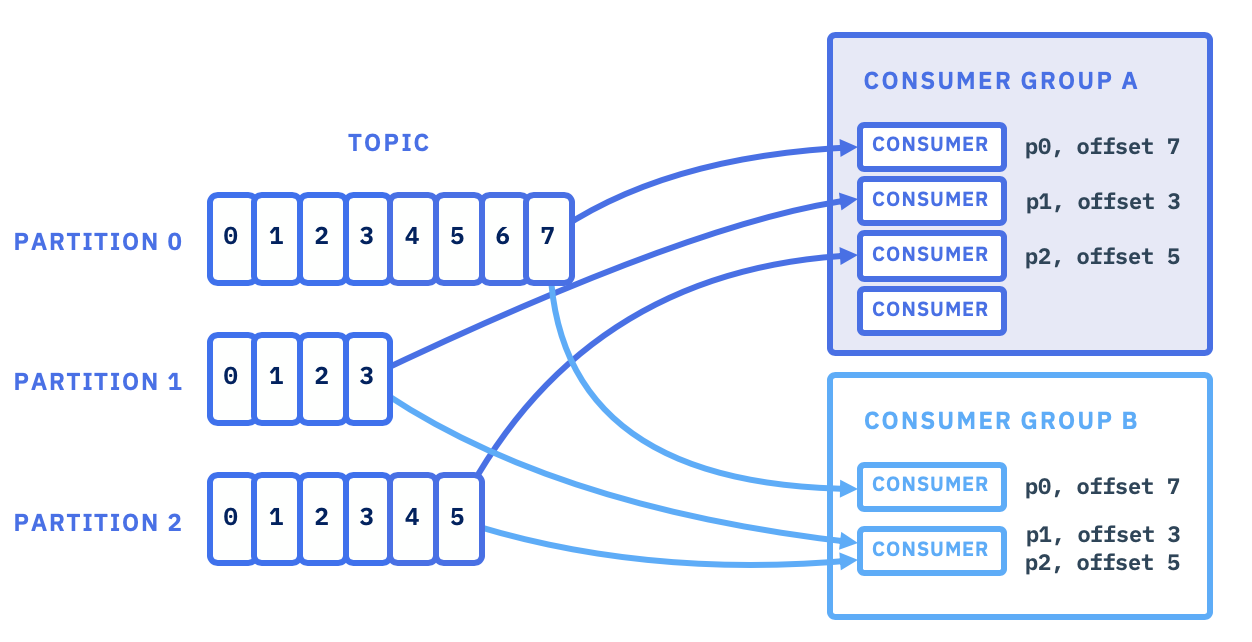
Explanations
- Consumer application define a property to group multiple instances of those application into a group.
- Topic partitions are only here to support scaling consumer processing
- Brokers are keeping information about group, offset and partition allocation to consumer
- When a consumer is unique in a group, it will get data from all partitions.
- We cannot have more consumer than number of topic, if not the consumer will do nothing
- Membership in a consumer group is maintained dynamically
- When the consumer does not send heartbeats for a duration of
session.timeout.ms, then it is considered unresponsive and its partitions will be reassigned. - For each consumer group, Kafka remembers the committed offset for each partition being consumed.
- Understanding offset
- Get more details on consumer best practices
Recall that offset is just a numeric identifier of a consumer position of the last record read within a partition. Consumers periodically need to commit the offsets they have received, to present a recovery point in case of failure.
For reliable consumers, it means the commitment of the read offset is done by code once the consumer is done with its processing. There is an important limitation within App Connect Kafka consumer node as there is no way to commit by code, so do not propose App Connect as a viable solution if you need to do not loose message. Or support adding new java custom code to do the management of offset.
From Event Streams demonstration point of view, we can only demonstrate consumer groups for a given topic, and if consumers are behind in term of reading records from a partition.
-
In the Event Streams console go to the
Topicsview andConsumer Groups tabof one of the topic. The figure below shows that there is no active member for the consumer groups , and so one partition is not consumed by any application.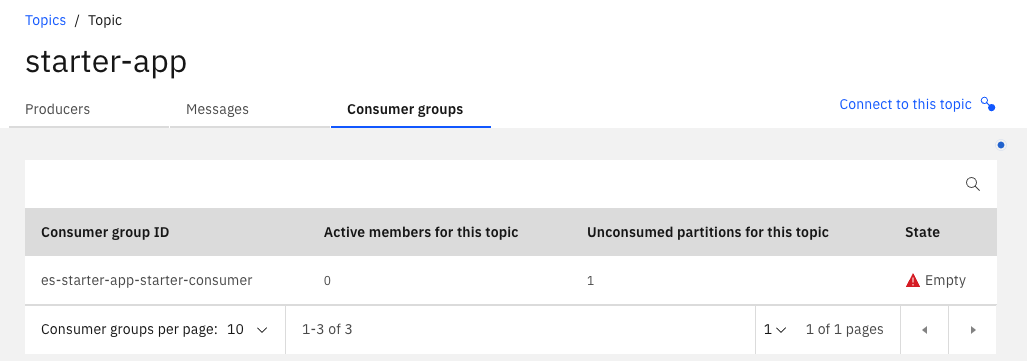
-
Another view is in the
Consumer Groupswhich lists all the consumer groups that have been connected to any topic in the cluster: This view helps to assess if consumer are balanced. Selecting one group will zoom into the partition and offset position for member of the group. Offset lag is what could be a concern. The consumer lag for a partition is the difference between the offset of the most recently published message and the consumer's committed offset.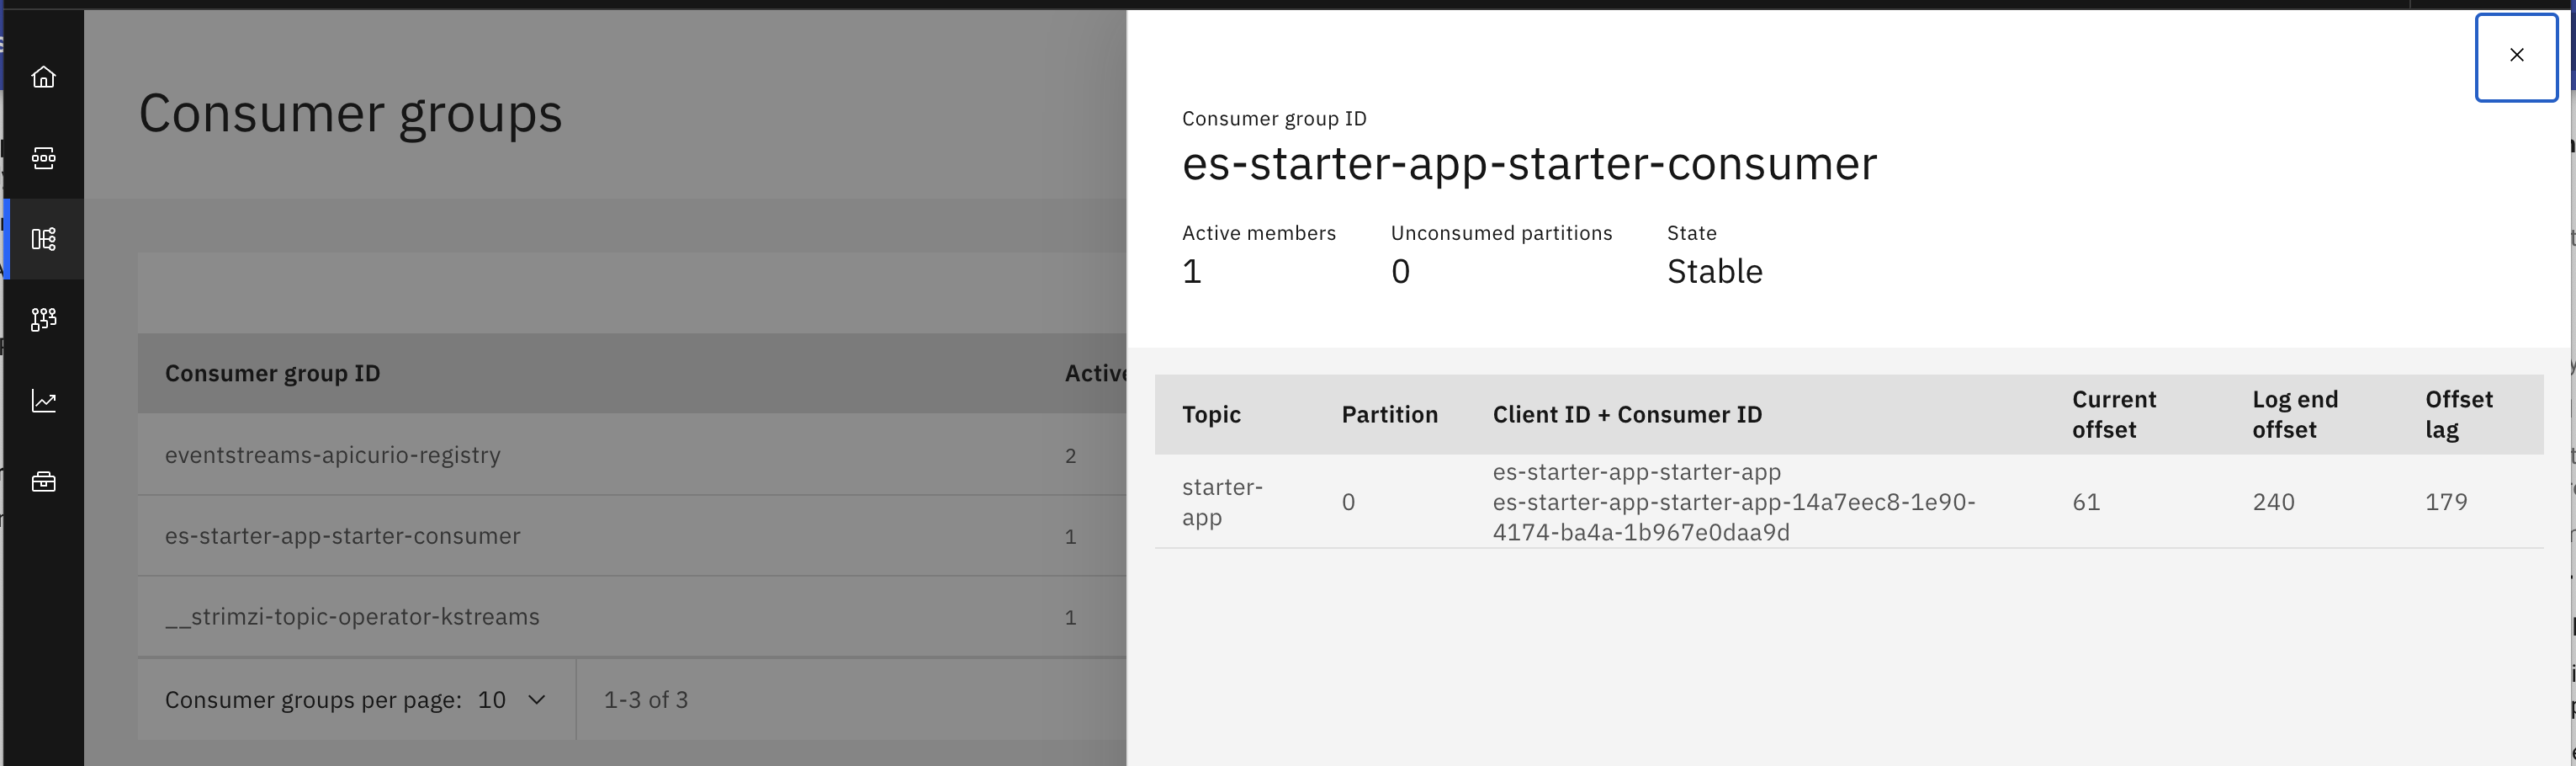
Consumer lag may show that consumers are not processing records at the same pace that producer is publishing them. This could not be a problem, until this lag is becoming too high and compaction or retention by time or size will trigger, removing old records. In this case consumers will miss messages.
User management and security
There are two types of user management in Event Streams: the human users, to access the user interface and the application users to access Brokers and Kafka Topics.
Application users are defined with KafkaUser custom resources. The Yaml also describes access control list to the topic. The following KafkaUser yaml file is an example of application user used to authenticate with mutual TLS.
Such user can also being created by using the connect to the cluster option in Event Streams console.
The Acces Control Lists are defined by specifying the resource type and the type of operation authorized. User certificates and passwords are saved in secrets. The ACL rules define the operations allowed on Kafka resources based on the username:
acls:
- resource:
    type: topic
    name: 'rt-'
    patternType: prefix
operation: Write
- resource:
    type: topic
    name: '*'
    patternType: literal
operation: Read
- resource:
    type: topic
    name: '*'
    patternType: literal
operation: Create
For human authentication, users are defined using IBM Cloud Pak foundational services Identity and Access Management (IAM). Things to keep in mind:
- IAM is in Cloud Pak | Administation console. A URL like: https://cp-console.apps........ibm.com/common-nav/dashboard
-
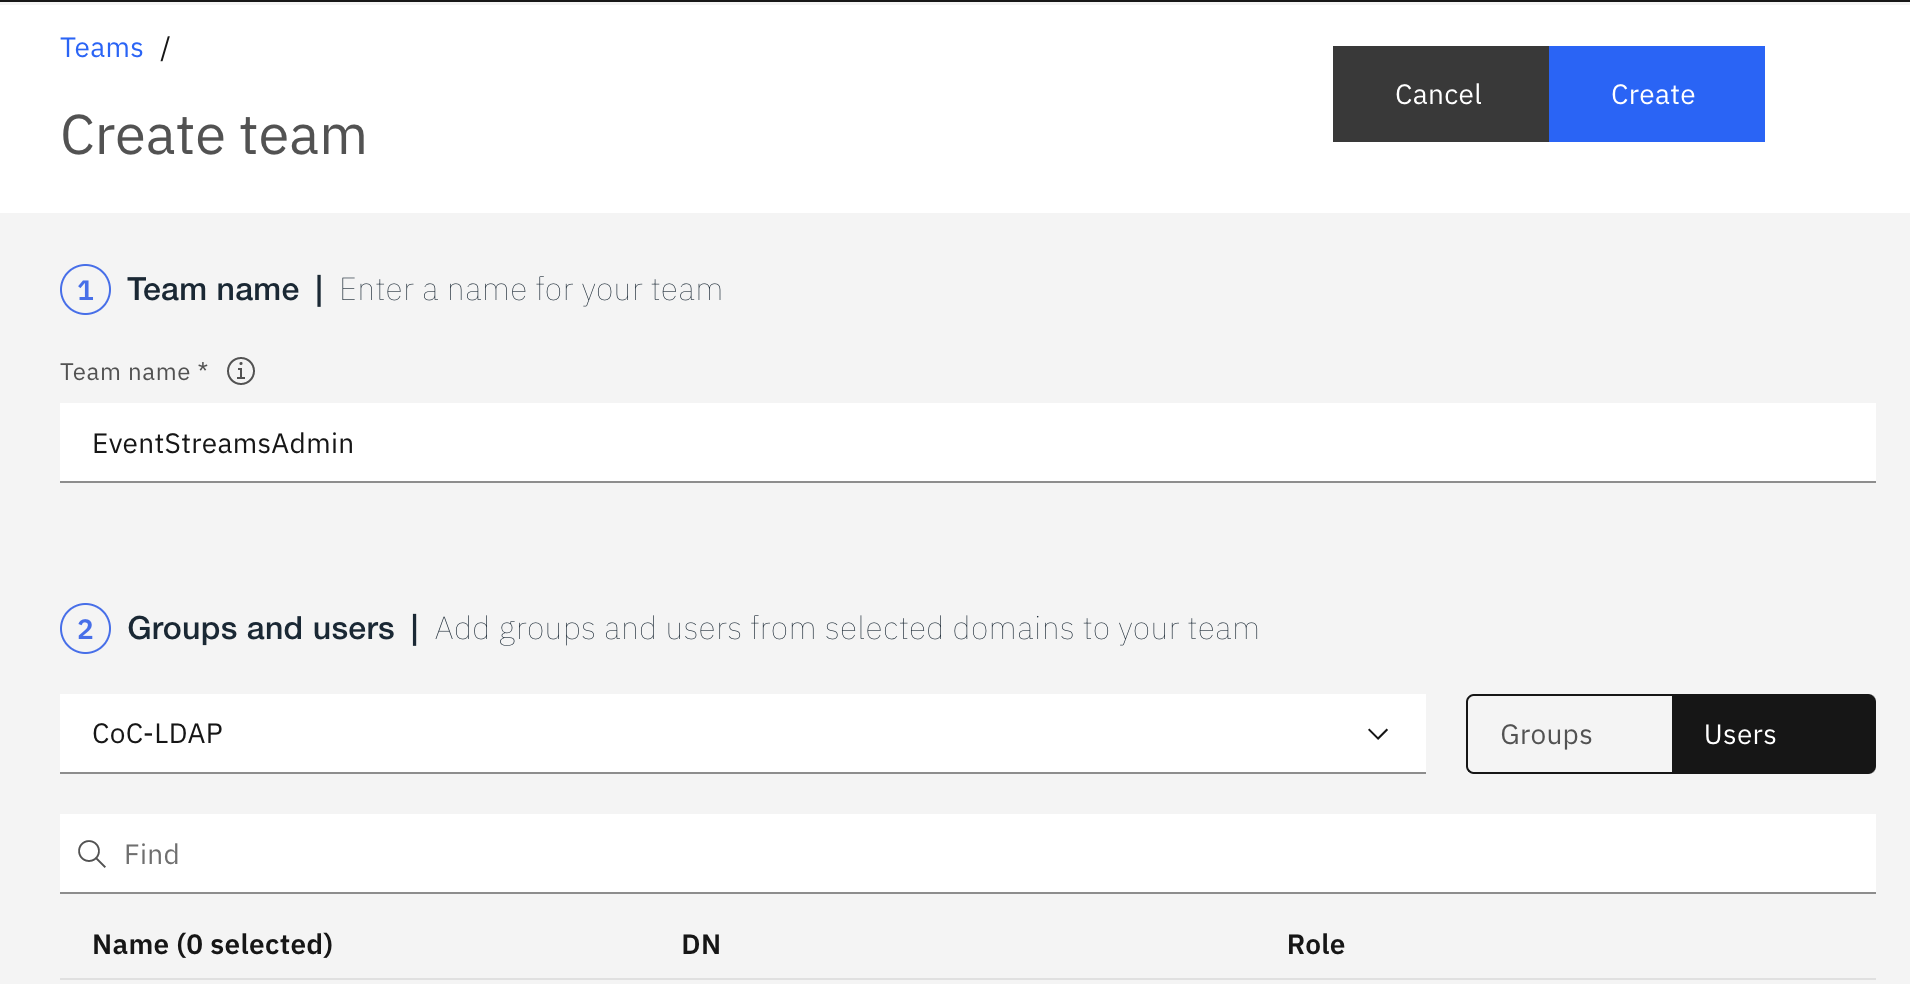
Need to define a team for resources, administrator users... using he Administration console and IAM menu:
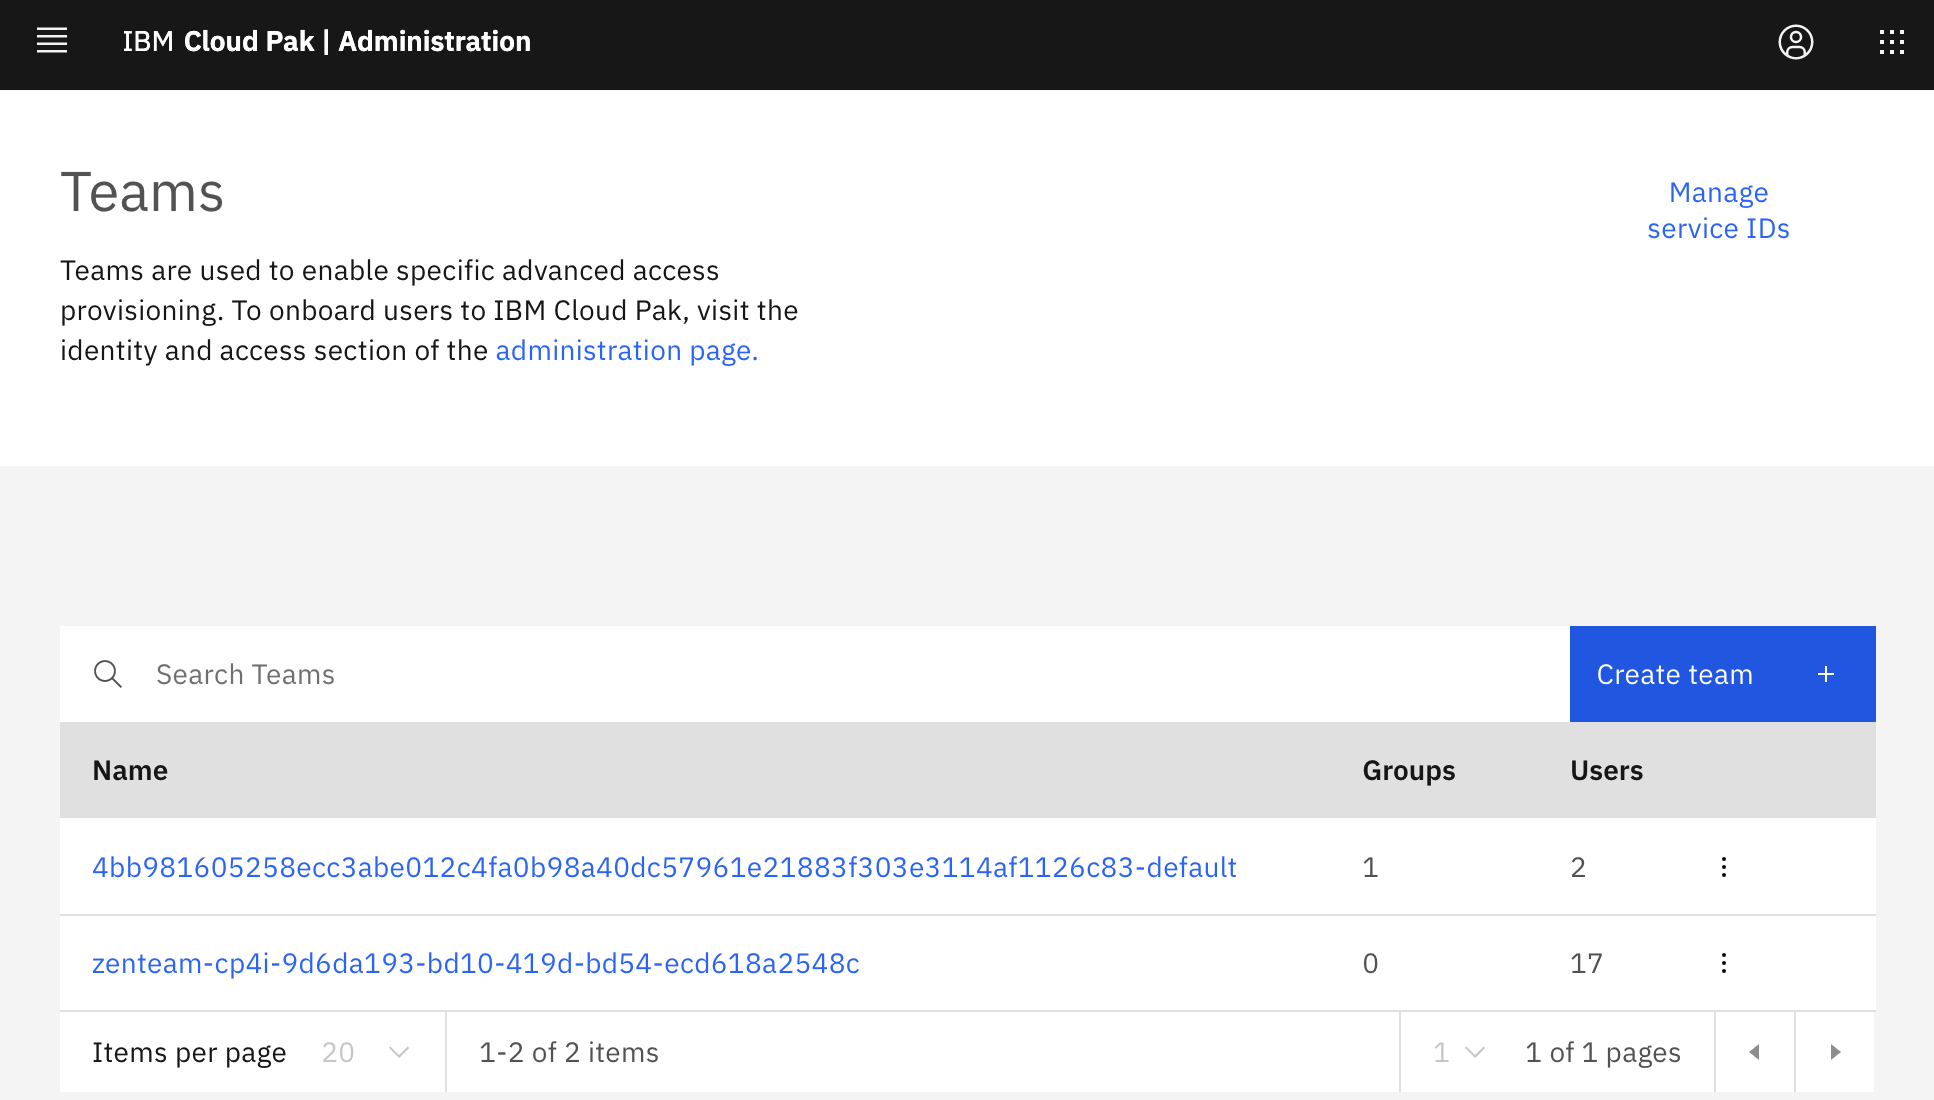
Define new team, with connection to an active directory / identity provider:
-
Any groups or users added to an IAM team with the
Cluster AdministratororAdministratorrole can log in to the Event Streams UI and CLI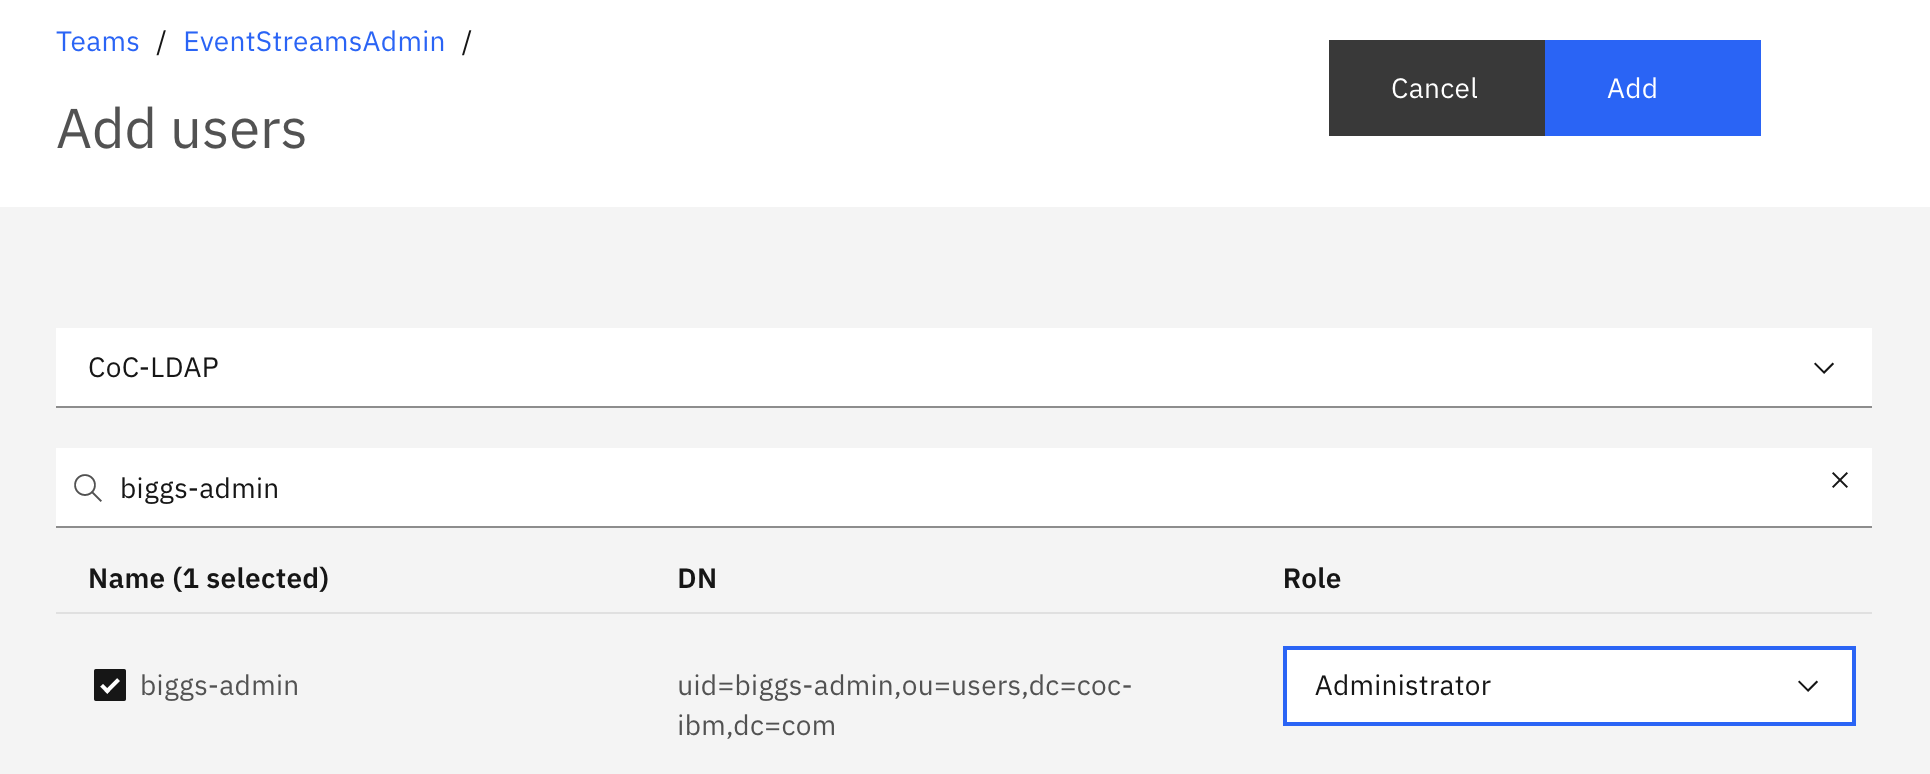
or non admin user:
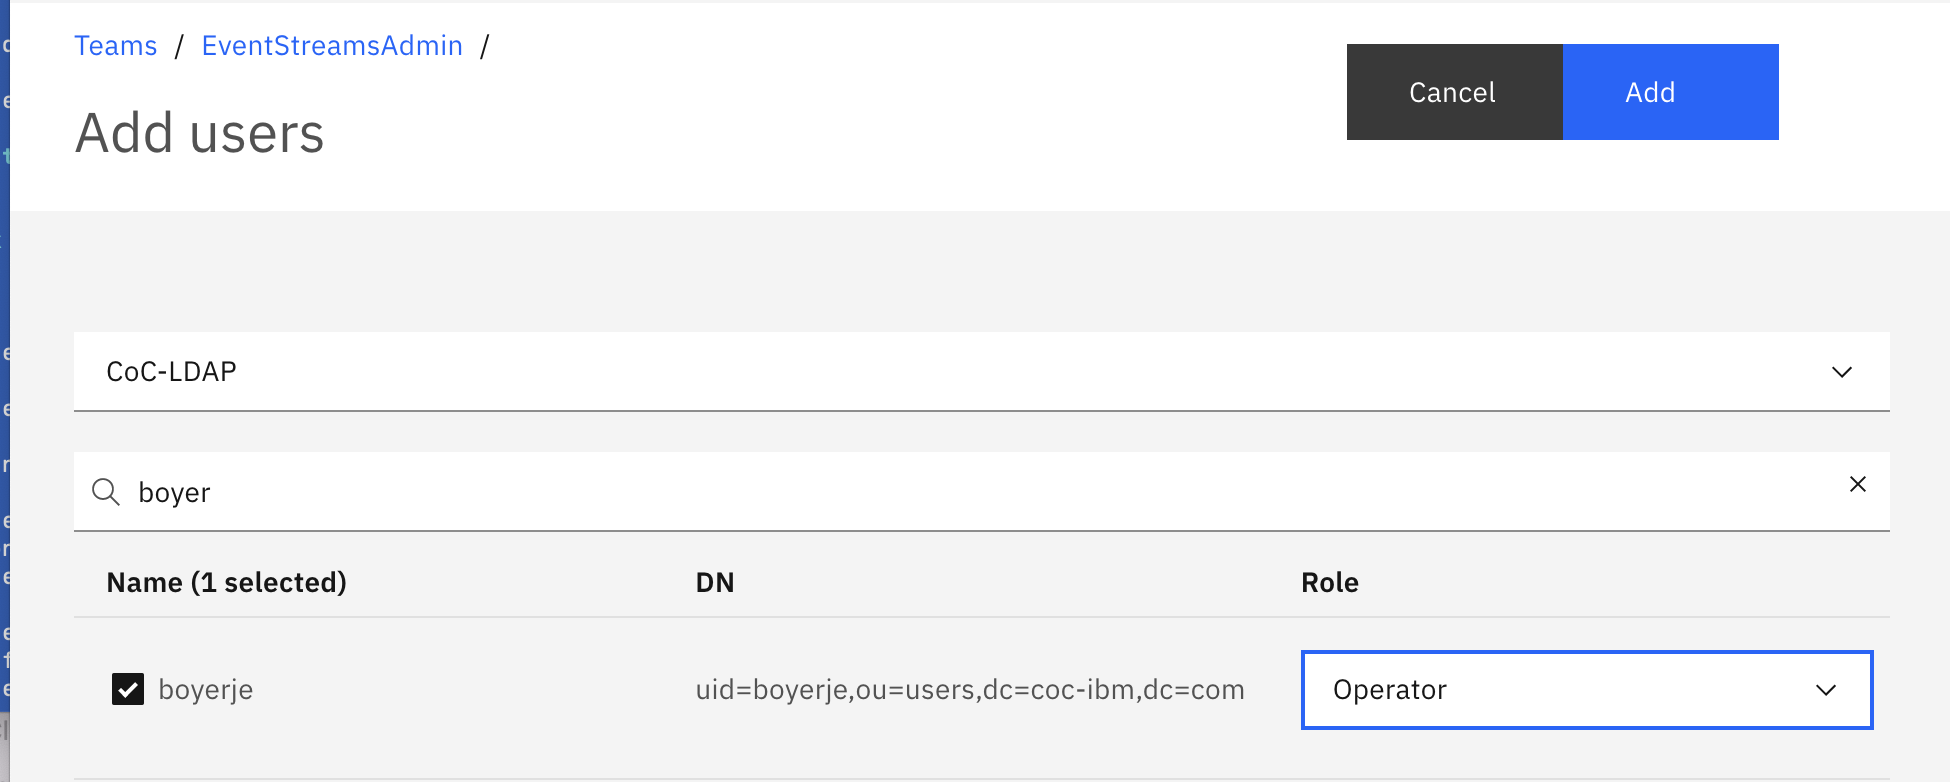
-
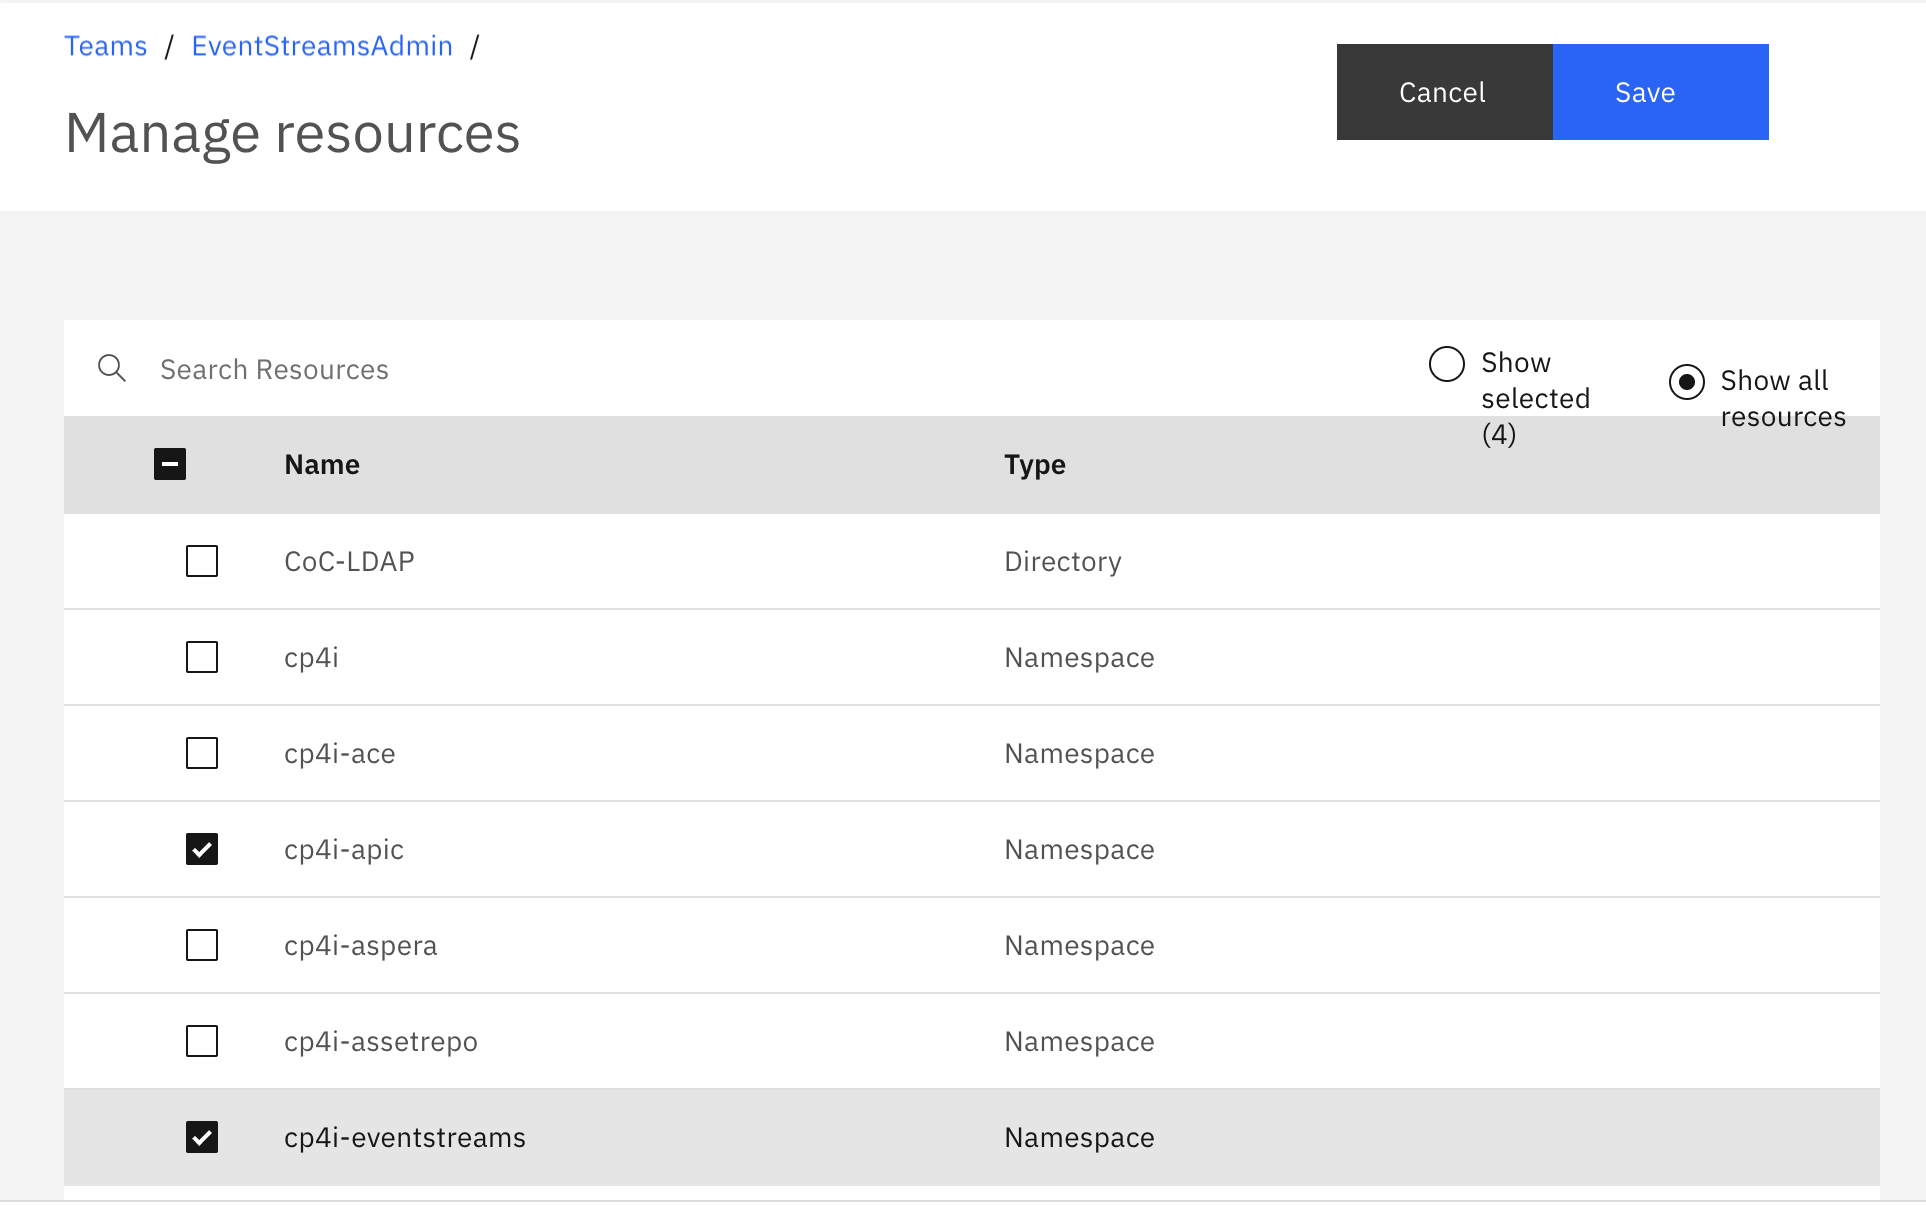
Any groups or users with the Administrator role will not be able to log in until the namespace that contains the Event Streams cluster is added as a resource for the IAM team.
-
If the cluster definition includes
spec.strimziOverrides.kafka.authorization: runas, users are mapped to a Kafka principal
Read more
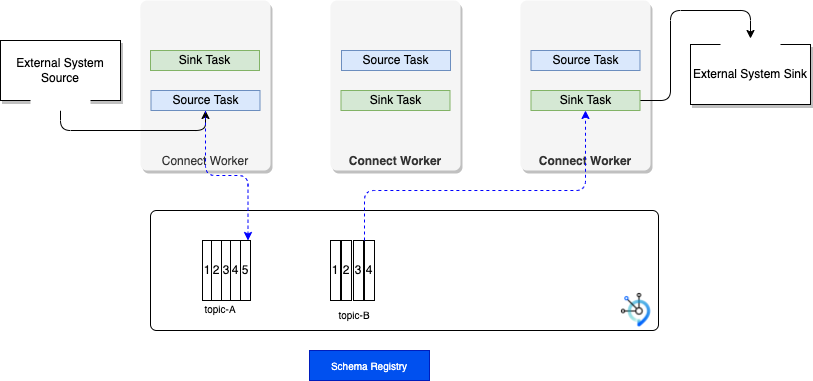
Kafka Connect
Kafka connect is used to connect external systems to Event Streams brokers. For production deployment the Kafka connect connectors run in cluster, (named distributed mode), to support automatic balancing, dynamic scaling and fault tolerance. In the figure below, we can see Kafka Connect cluster builds with 3 worker processes. The configuration if such worker is done with one file, that can be managed in your GitOps. (An example of such file is here)
Event Streams Operator supports custom resource to define Kafka connect cluster. Each connector is represented by another custom resource called KafkaConnector.
When running in distributed mode, Kafka Connect uses three topics to store configuration, current offsets and status.
Once the cluster is running, we can use custom resource to manage the connector. For example to get a MQ Source connector definition example, you can browse this yaml which specifies how to connect to the MQ broker and how to create records for Kafka.
apiVersion: eventstreams.ibm.com/v1alpha1
kind: KafkaConnector
metadata:
  name: mq-source
  labels:
    eventstreams.ibm.com/cluster: eda-kconnect-cluster
spec:
  class: com.ibm.eventstreams.connect.mqsource.MQSourceConnector
  tasksMax: 1
  config:
    mq.queue.manager: QM1
    mq.connection.name.list: store-mq-ibm-mq.rt-inventory-dev.svc
    mq.channel.name: DEV.APP.SVRCONN
    mq.queue: ITEMS
    mq.bath.size: 250
    producer.override.acks: 1
    topic: items
    key.converter: org.apache.kafka.connect.storage.StringConverter
    value.converter: org.apache.kafka.connect.storage.StringConverter
    mq.record.builder: com.ibm.eventstreams.connect.mqsource.builders.DefaultRecordBuilder
    mq.connection.mode: client
    mq.message.body.jms: true
    mq.record.builder.key.header: JMSCorrelationID
to improve connector source throughput we can control the producer properties like the acknowledge level expected.
The real time inventory demo includes MQ source connector.
Monitoring
The IBM Event Streams UI provides information about the health of your environment at a glance. In the bottom right corner of the UI, a message shows a summary status of the system health.
- Using the JMX exporter, you can collect JMX metrics from Kafka brokers, ZooKeeper nodes, and Kafka Connect nodes, and export them to Prometheus
Warning
Be aware IBM Cloud Pak foundational services 3.8 and later does not include Prometheus so you will get Event Streams metrics not available error message. On Biggs as of 04/19/22, the cluster configuration was done. If you need to do it on your cluster see those two files: cluster-monitoring-cm.yaml to enable user workload monitoring with Prometheus and pod-monitors.yaml to declare the PodMonitor to define scrapeable endpoints of a Kubernetes Pod serving Prometheus metrics.
-
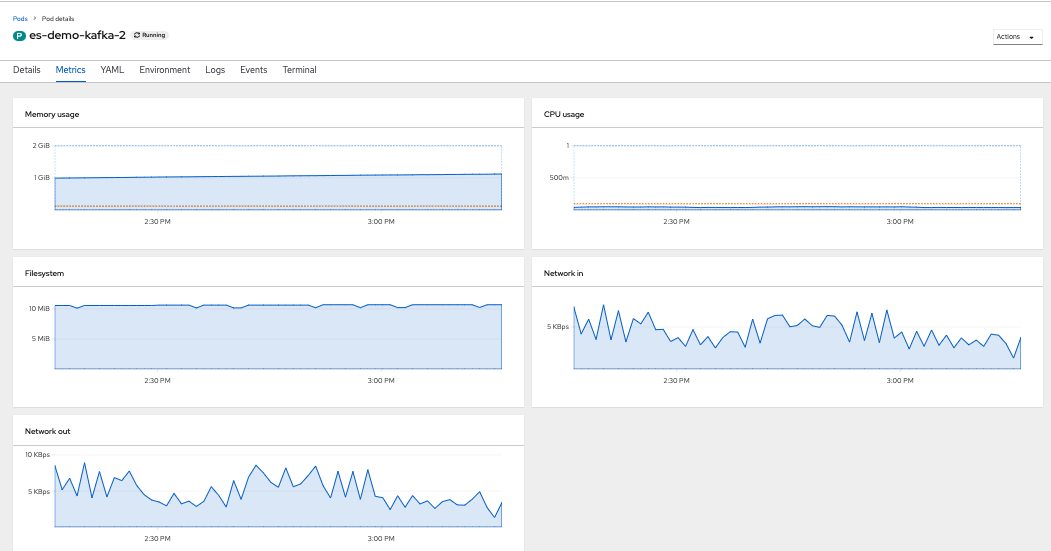
Assess Event Streams cluster state: Go to the project where the cluster runs, select one of the Kafka Pod. You can see the pod via the OpenShift workloads menu, or by using the Event Streams Operator > Resources and then filter on pods:
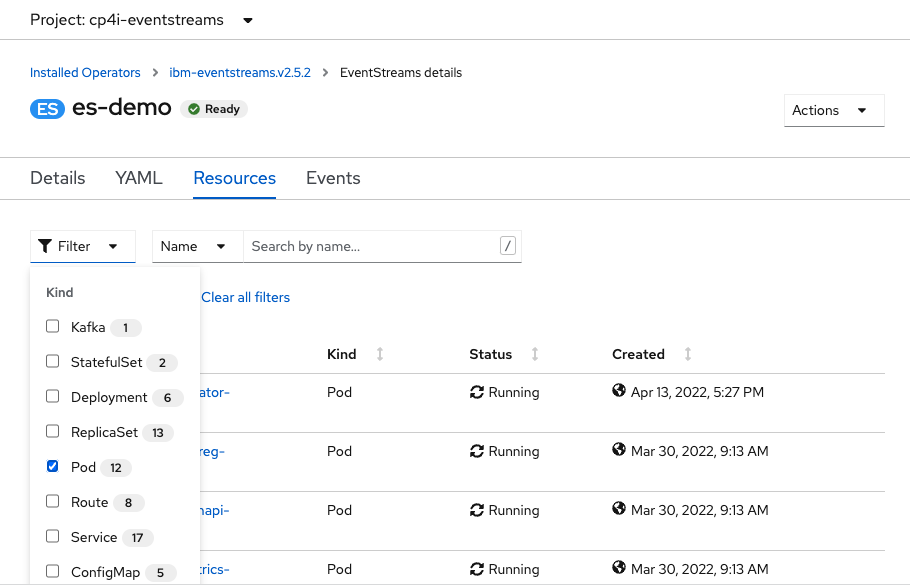
Select one of the pods and go to the metrics to see memory, CPU, network and filesystem usage metrics.
-
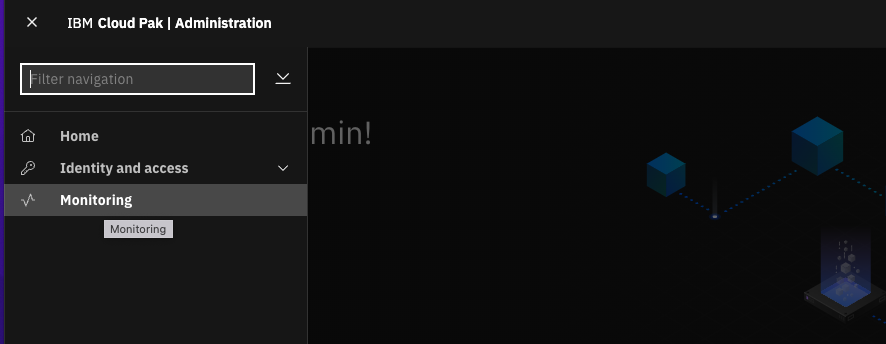
Access the Cloud Pak | Administration console to select Monitoring
-
Switch organization to select where
Event Streamsis running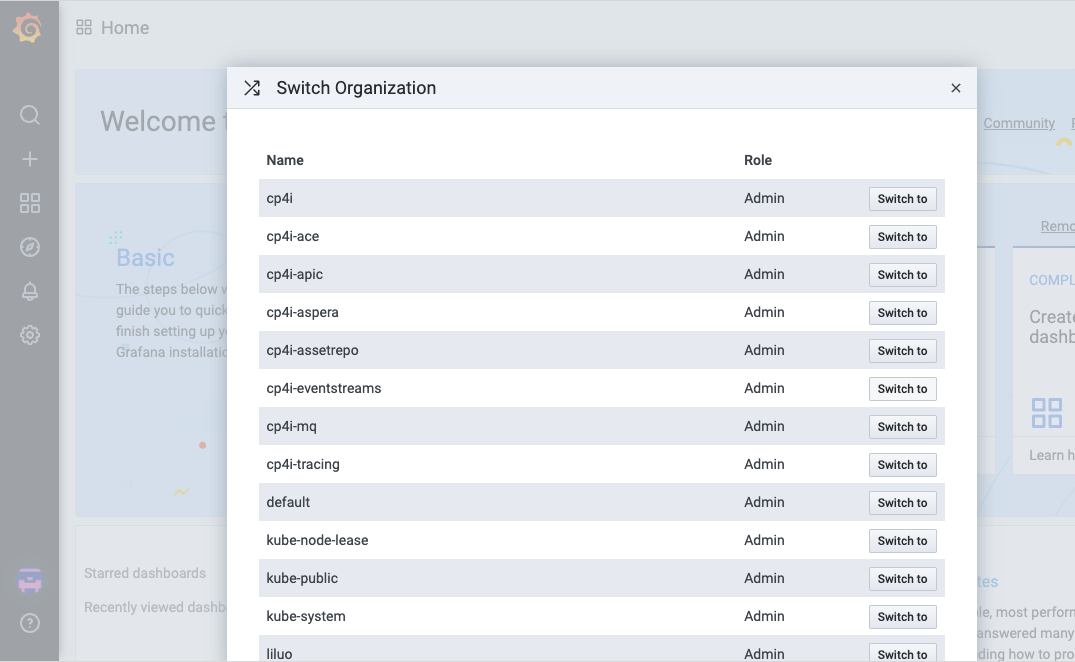
-
Then go to the grafana Dashboard menu on the left > Manage and select event streams dashboard
-
In the Grafana dashboard select the namespace for event streams (e.g.
cp4i-eventstreams), the cluster name (es-demo), the brokers, and the topic to monitor.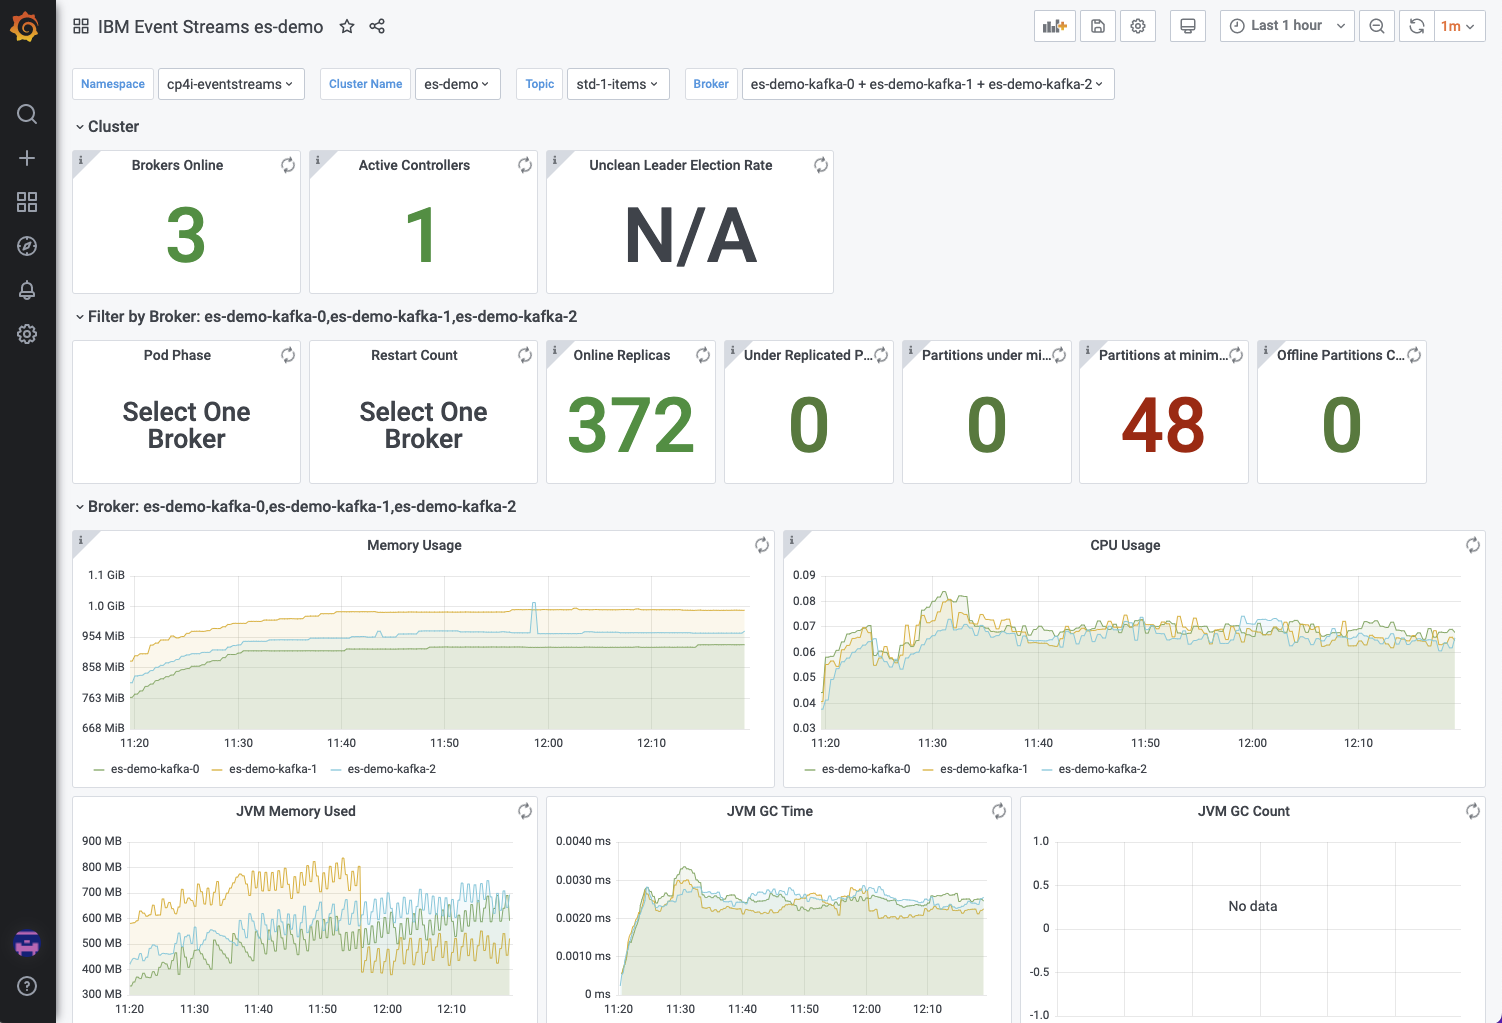
More reading
Event Streaming
Kafka Streams
Kafka Streams is client API to build microservices with input and output data are in Kafka. It is based on programming a graph of processing nodes to support the business logic developer wants to apply on the event streams.
Apache Flink as your streaming platform
To be done.
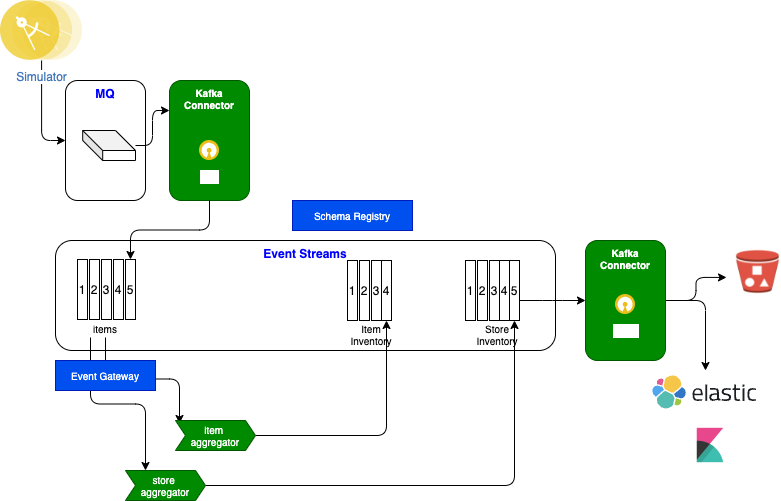
Real-time inventory demo
It is possible to propose a more complex solution to illustrate modern data pipeline using components like MQ source Kafka Connector, Kafka Streams implementation and Cloud Object Storage sink, Elastic Search and Pinot.
This scenario implements a simple real-time inventory management solution based on some real life MVPs we developed in 2020. For a full explanation of the use case and scenario demo go to this chapter in EDA reference architecture.
The solution can be deployed using few commands or using GitOps.
See Lab3-4
More Reading
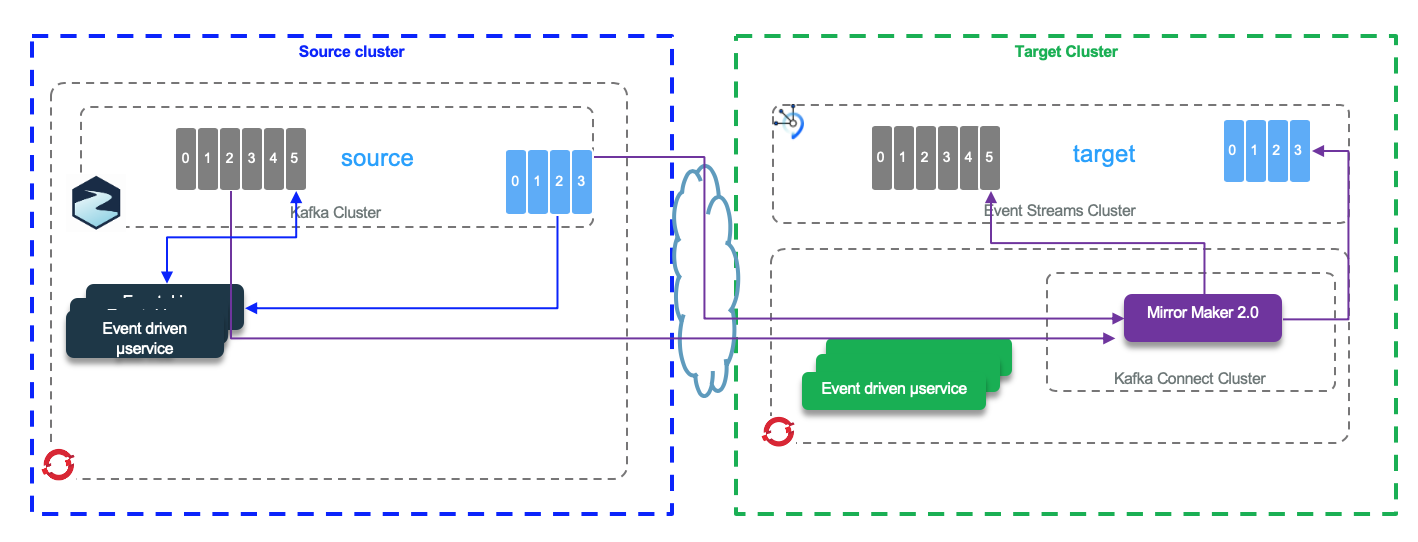
Geo-replication
We will go over two main concepts: replication to a passive and active Event Streams cluster. Geo Replication is the IBM packaging of Mirror Maker 2.
Demonstrating Geo Replication
The geo-replication feature creates copies of your selected topics to help with disaster recovery.
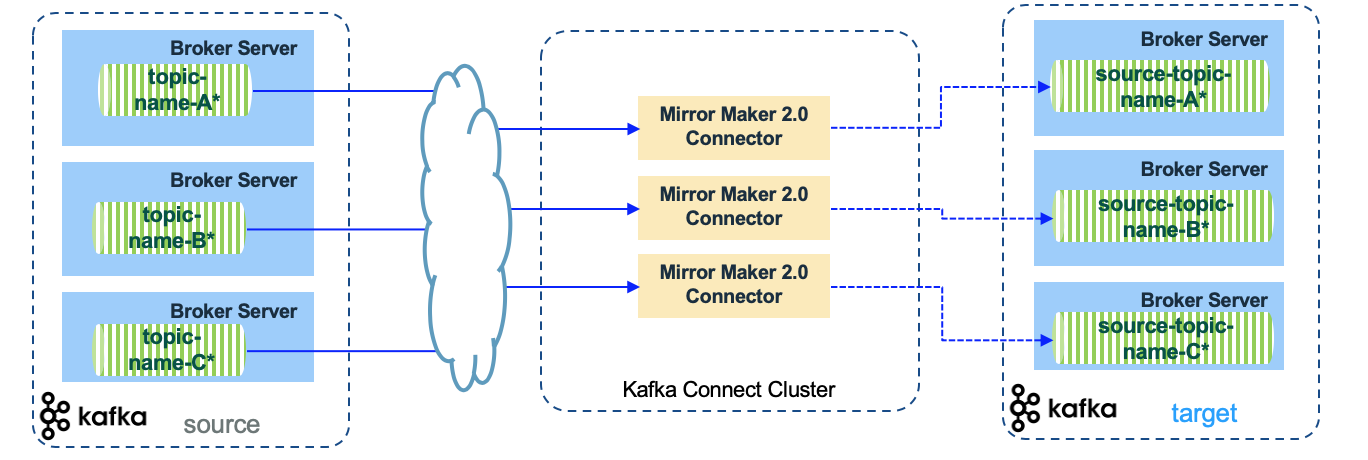
Mirror Maker 2
Mirror Maker 2 is a Kafka Connect framework to replicate data between different Kafka Cluster, so it can be used between Event Streams clusters, but also between Confluent to/from Event Streams, Kafka to/from Event Streams...
The following diagram can be used to present the MM2 topology
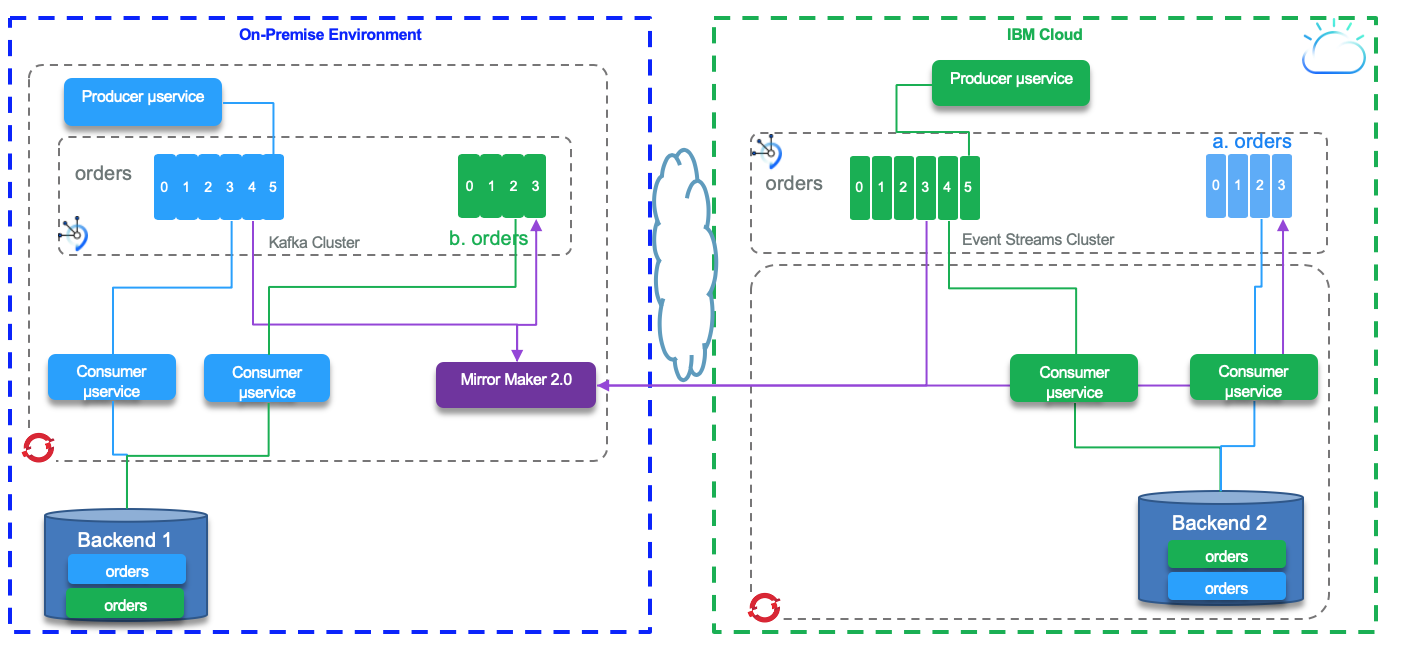
Active - Passive
See a demonstration for the real-time inventory and replication in this article
Active - Active
Read more
Day 2 operations
In this section, you should be able to demonstrate some of the recurring activities, operation team may perform for the Event Streams and OpenShift platform for maintenance:
- Change Cluster configuration
- Add topic or change topic configuration like adding partition
GitOps
The core idea of GitOps is having a Git repository that always contains declarative descriptions of the infrastructure currently desired in the production environment and an automated process to make the production environment matches the described state in the repository. Git is the source of truth for both application code, application configuration, dependant service/product deployments, infrastructure config and deployment.
In the following figure, we just present the major components that will be used to support GitOps and day 2 operations:
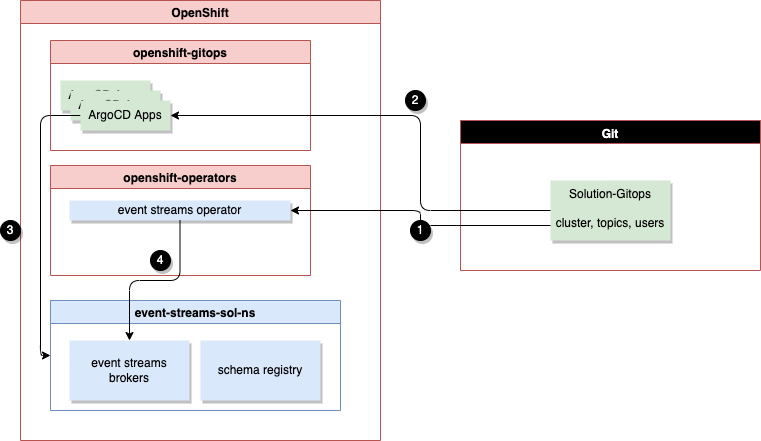
Explanations
- cluster configuration, topics, users ACL are defined as yaml resources in the solution GitOps. Cluster example for prod
- (1) Operator definitions are also defined in the gitops and then change to the version subscription will help do product upgrade. Event Streams subscription with overlays for a new version.
- (2) ArgoCD apps are defined in the GitOps and then once running on the GitOps Server, will monitor changes to the source gitOps content
- (3) when change occurs, the underlying kubernetes resources are modified
- (4) Operator maintains control to the runtime pods according to the modified manifest
Cloud Pak for integration, event streams, MQ, API Connect operators help to support deployment as a Day 1 operation, but also support maintenance or Day 2 operations. Operator is constantly watching your cluster’s desired state for the software installed and act on them.
Using a GitOps approach, we can design a high-level architecture view for the deployment of all the event-driven solution components: as in previous figure, operators, ArgoCD apps, cluster, topics... are defined in the solution gitops and then the apps deployment, config map, service, secrets, routes are also defined according to the expected deployment model.
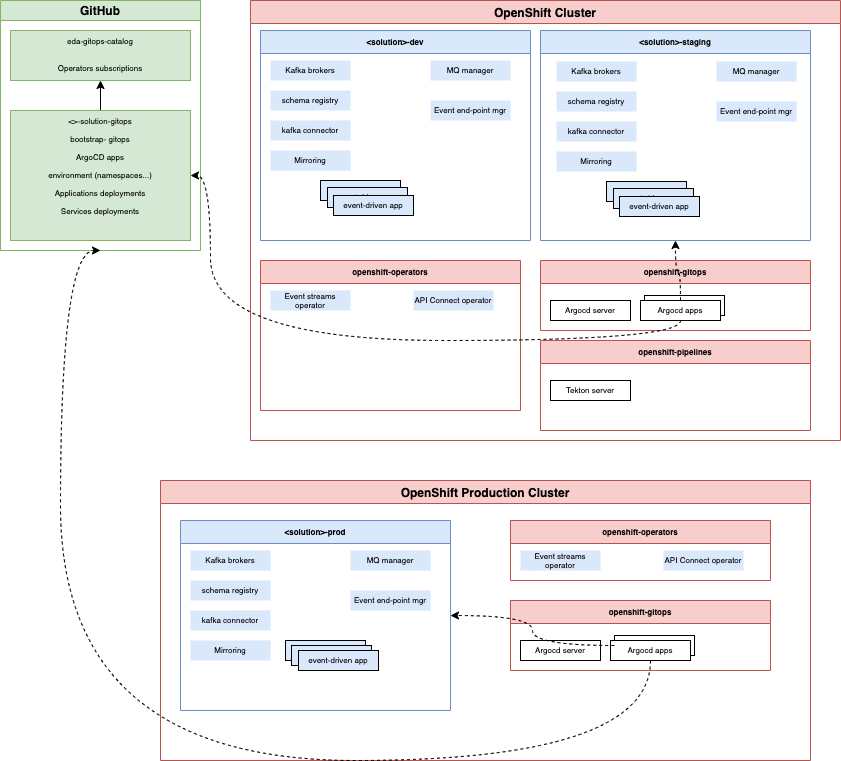
In the figure above, the dev, and staging projects have their own Event Streams clusters. Production is in a separate OpenShift Cluster and event streams cluster is multi-tenant.
We are using a special Git repository to manage a catalog of operator definitions/ subscriptions. This is the goal of the eda-gitops-catalog repository.
A solution will have a specific gitops repository that manages services (operands) and application specifics deployment manifests.
Start the GitOps demo
Warning
In the context of the Tech academy, if you want to use Gitops you should use the lab 4 exercise as it is a little bit simpler than to execute next section.
To be able to do continuous deployment we need to have some ArgoCD apps deployed on GitOps server. In all gitOps demos, we assume you have a fork of the eda-rt-inventory-gitops.
If you are not using a cluster with Event Streams already installed in the cp4i-eventstreams, you may need to modify the Copy Secret job () so it can get the ibm-entitlement-key from the good namespace.
-
If not done yet, jumpstart GitOps
1. Access to the ArgoCD console1. User ischrome https://$(oc get route openshift-gitops-server -o jsonpath='{.status.ingress[].host}' -n openshift-gitops)adminand password is the result of -
You should have two apps running in the default scope/ project.
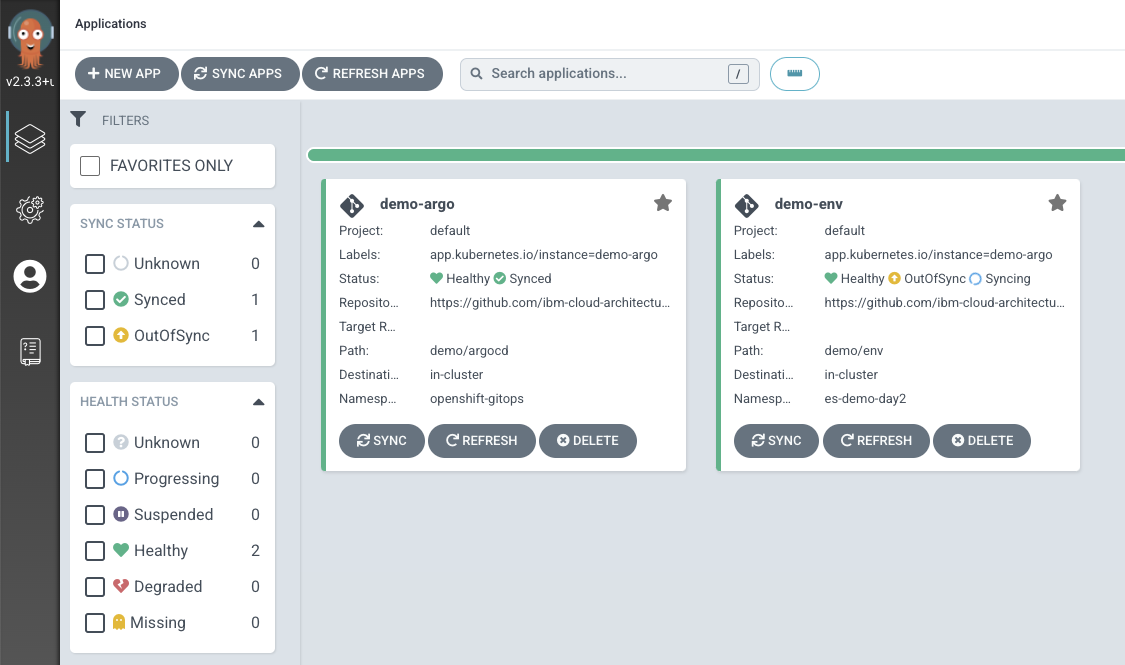
The argocd apps are monitoring the content of the demo/ env folder and once deployed, you should have a simple Event Streams node with one zookeeper under the project
es-demo-day2.
Event Streams cluster definition with GitOps
The goal of this section is to demonstrate how to define an Event Stream cluster with configuration and change the number of replicas. This is a very simple use case to try to use the minimum resources. So the basic cluster definition use 1 broker and 1 zookeeper. The file is es-demo.yaml. it is using Event Streams version 10.5.0 and one replicas
-
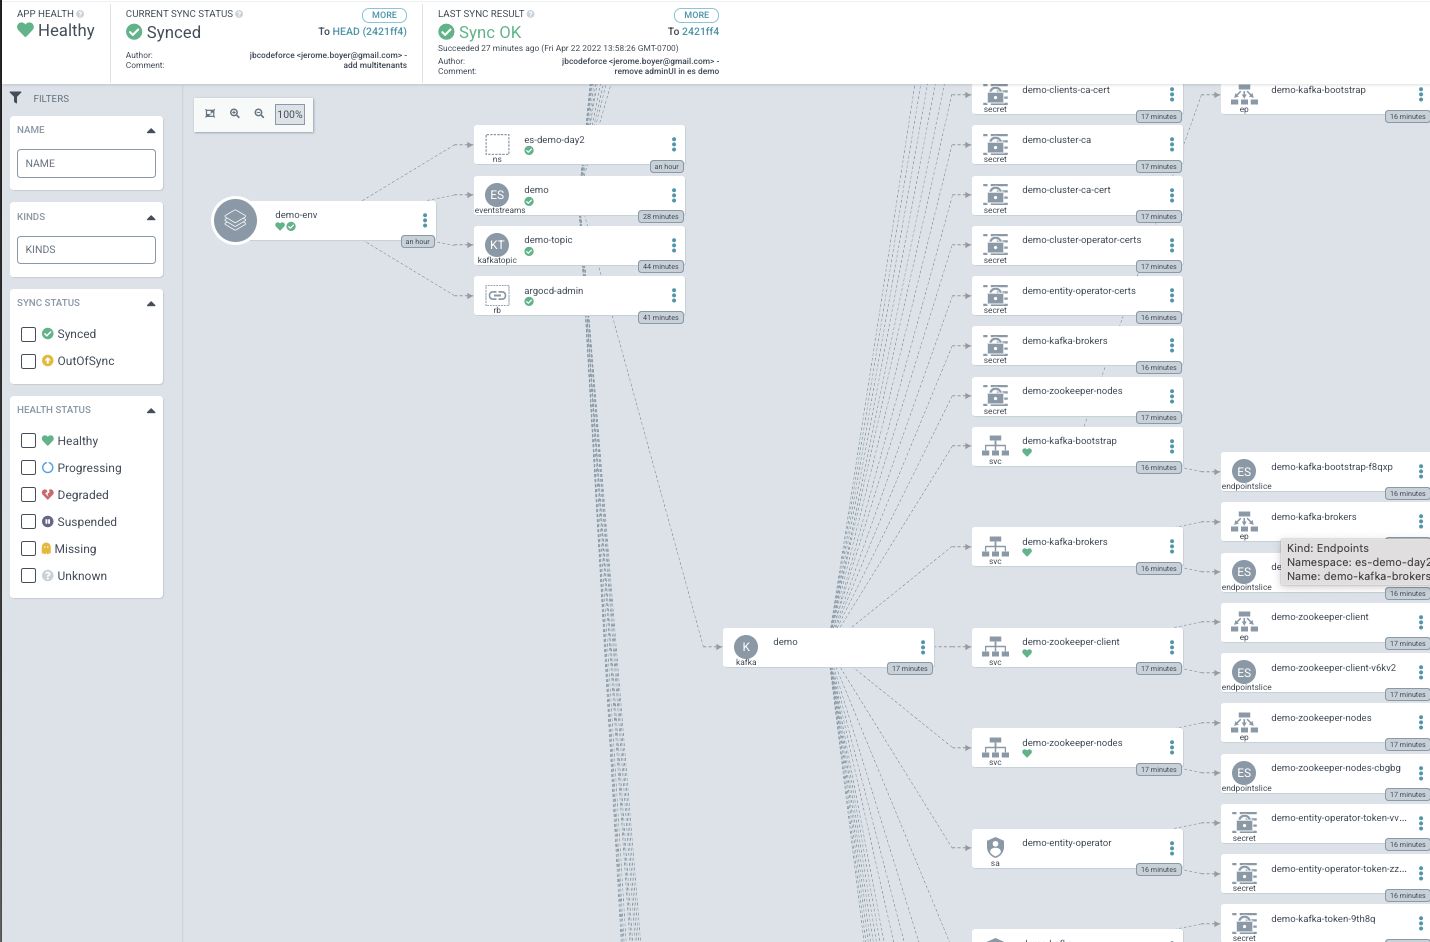
In GitOps console, if you go to the demo-env app, you will see there is one Kafka broker and also a lot of Kubernetes resources defined
-
In the
es-demo-day2project, useoc get podsto demonstrate the number of brokers -
Modify the number of replicas
-
Commit and push your changes to your git repository and see ArgoCD changing the configuration, new pods should be added.
-
You can enforce a refresh to get update from Git and then navigate the resources to see the new brokers added (demo-kafka-1):
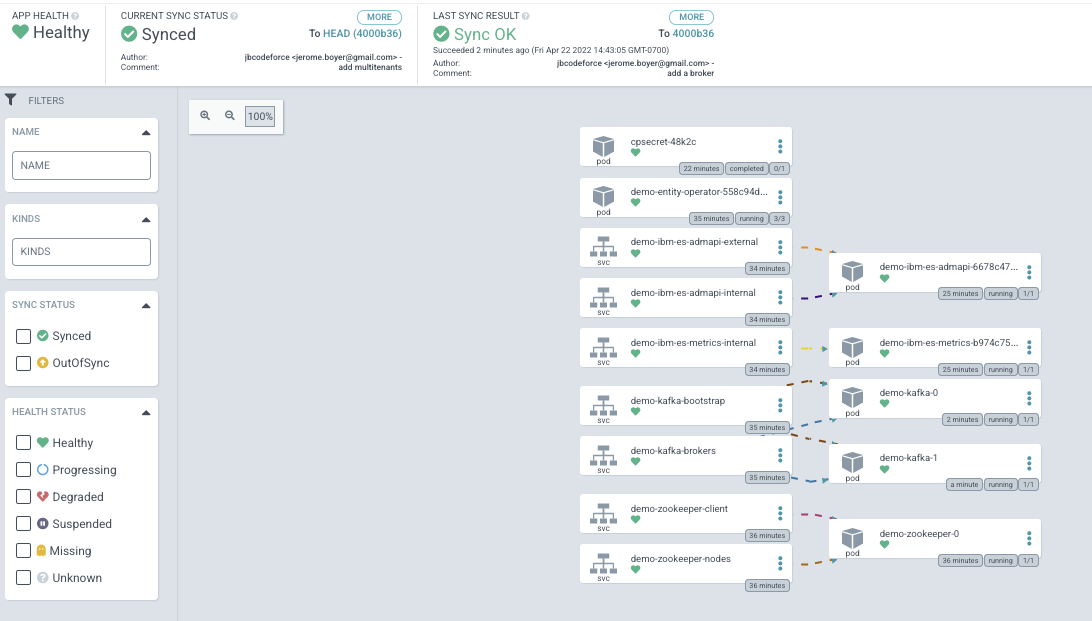
Adding a broker will generate reallocation for topic replicas.
Event Streams Cluster upgrade
This will be difficult to demonstrate but the flow can be explain using the OpenShift Console.
- First you need to be sure the cloud pak for integration services are upgraded. (See this note)
-
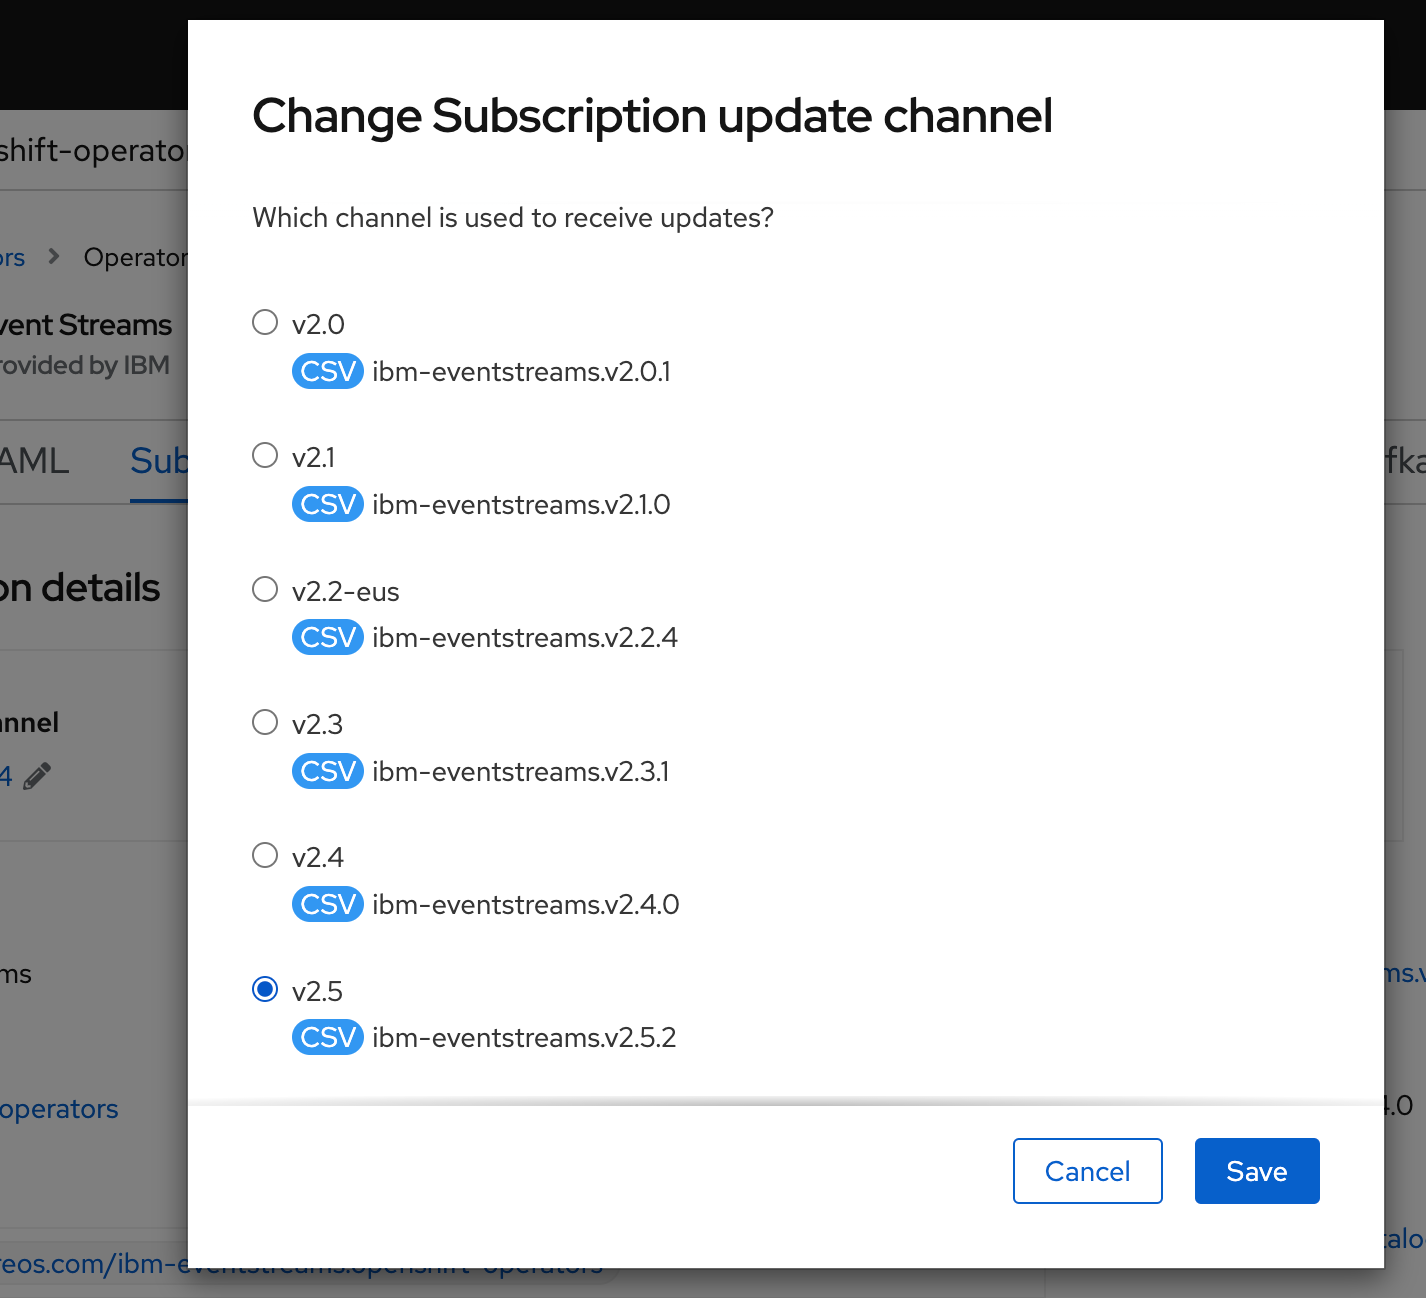
Two things to upgrade in this order: Event Streams operator and then the cluster instances.
You can upgrade the Event Streams operator to version 2.5.2 directly from version 2.5.x, 2.4.x, 2.3.x, and 2.2.x..
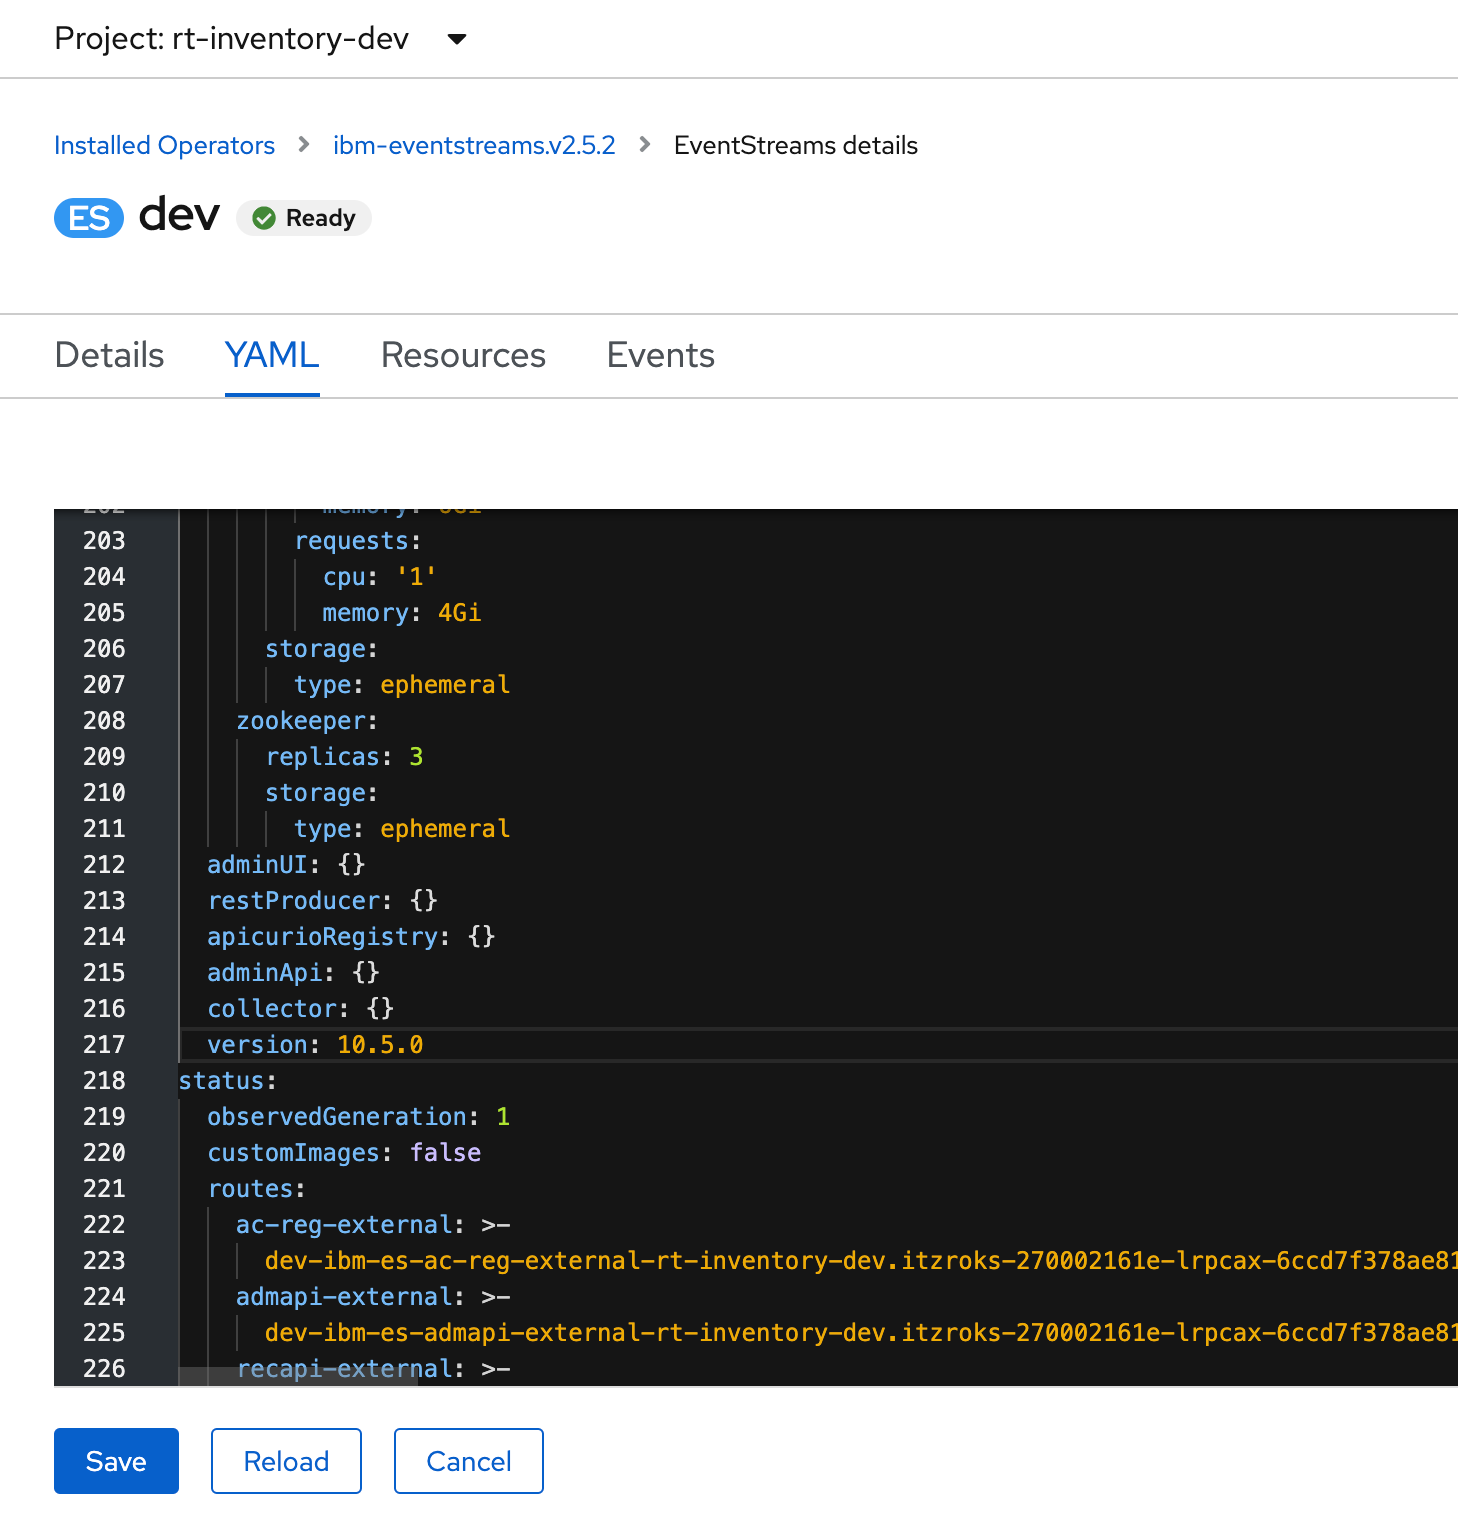
You can upgrade the Event Streams operand to version 11.0.0 directly from version 10.5.0, 10.4.x
-
Start by presenting the version of an existing running Cluster definition
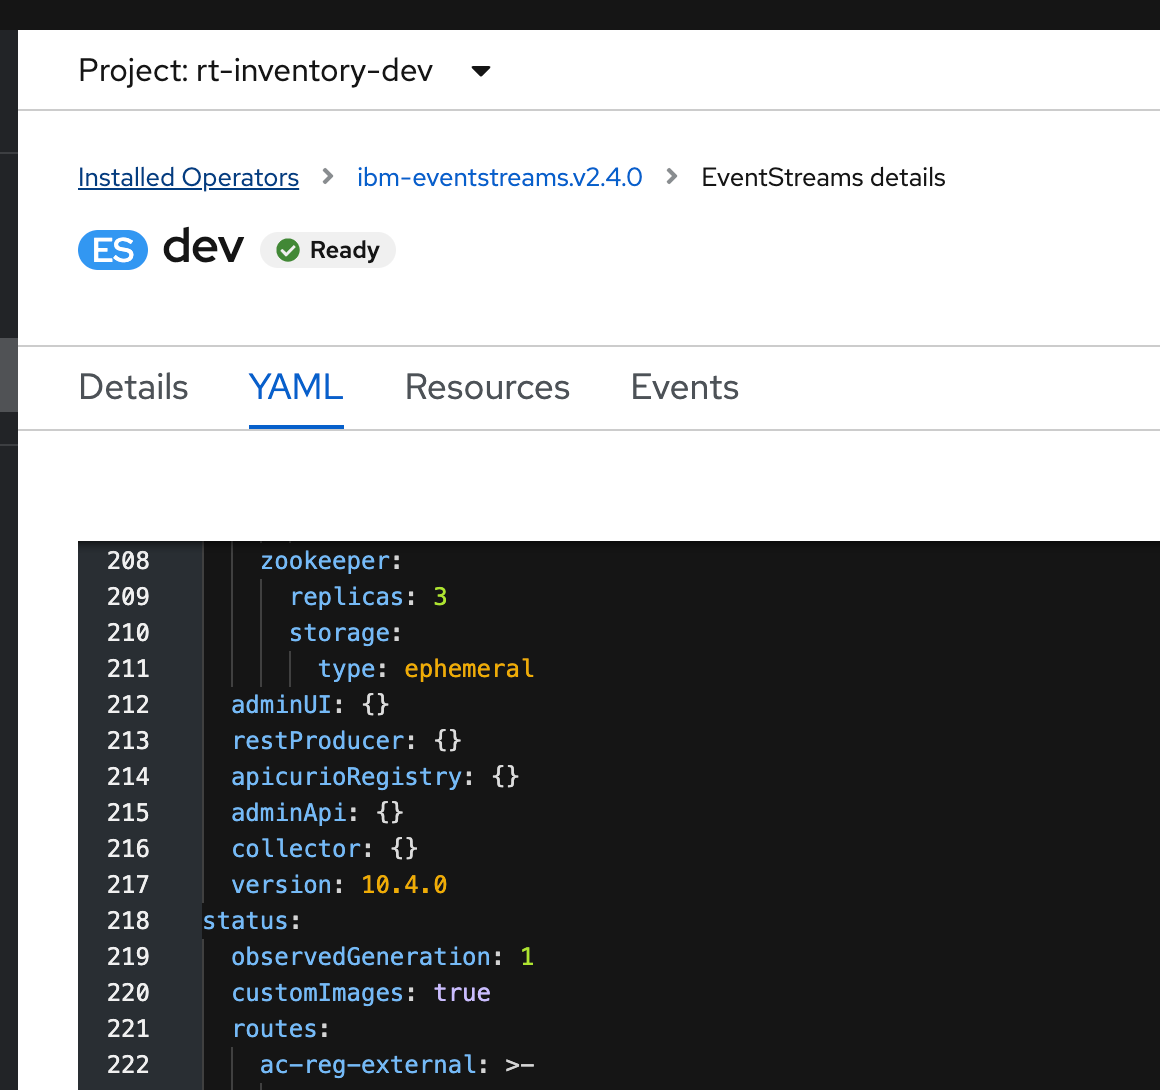
-
May be show some messages in a topic, for example the Store Simulator may have sent messages to the
itemstopic -
Go to the
openshift-operatorsand select the event streams operator, explain the existing chaneel then change the channel number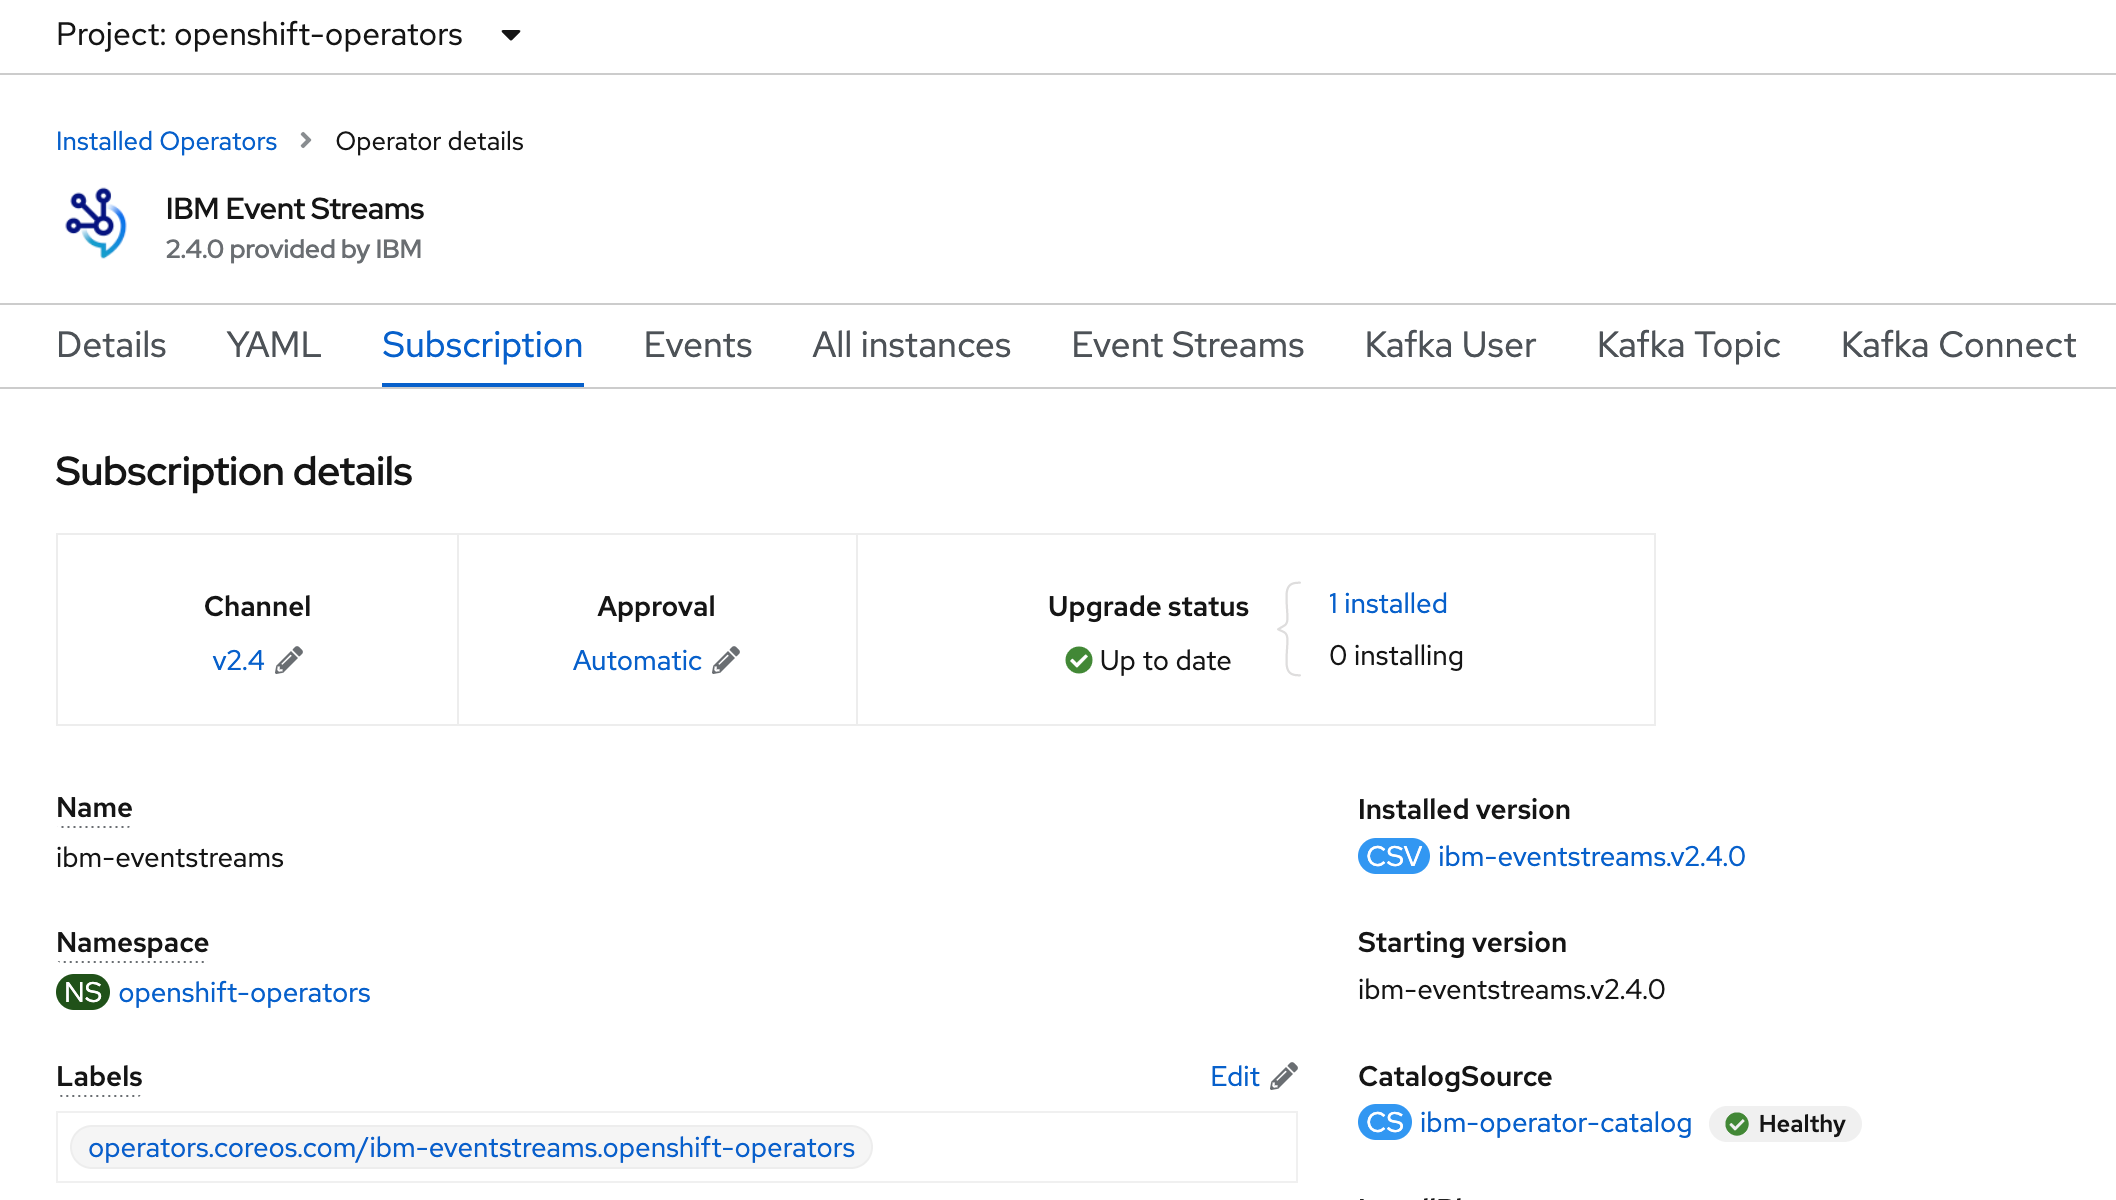
- Event Streams instance must have more than one ZooKeeper node or have persistent storage enabled.
- Upgrade operator is by changing the channel in the operator subscription. All Event Streams pods that need to be updated as part of the upgrade will be gracefully rolled. Where required ZooKeeper pods will roll one at a time, followed by Kafka brokers rolling one at a time.
-
Update the cluster definition version to new version (10.5.0 in below screen shot), thne this will trigger zookeeper and kafka broker update.
Topic management with GitOps
The goal of this section is to demonstrate how to change topic definition using Argocd and git.
-
Modify the file es-topic.yaml by adding a new topic inside this file with the following declaration:
-
Commit and push your changes to your git repository and see ArgoCD changing the configuration, new pods should be added.
- Do
oc get kafkatopicsor go to Event Streams operator in thees-demo-day2project to see all the Event Streams component instances.
Repartitioning
-
You can demonstrate how to change the number of partition for an existing topic (
rt-items) from 3 to 5 partitions: -
Add more instances on the consumer part: taking the
store-aggregatorapp and add more pods from the deployment view in OpenShift console, or change the deployment.yaml descriptor and push the change to the git repository so GitOps will catch and change the configuration:# modify https://github.com/ibm-cloud-architecture/eda-rt-inventory-gitops/blob/main/environments/rt-inventory-dev/apps/store-inventory/services/store-inventory/base/config/deployment.yaml oc apply -f environments/rt-inventory-dev/apps/store-inventory/services/store-inventory/base/config/deployment.yaml

Clean your gitops
- Remove the ArgoCD apps
- Remove resources
OpenShift Cluster version upgrade
There may be some questions around how to migrate a version for OCP.
Principles
For clusters with internet accessibility, Red Hat provides over-the-air updates through an OpenShift Container Platform update service as a hosted service located behind public APIs.
Due to fundamental Kubernetes design, all OpenShift Container Platform updates between minor versions must be serialized.
What can be demonstrated
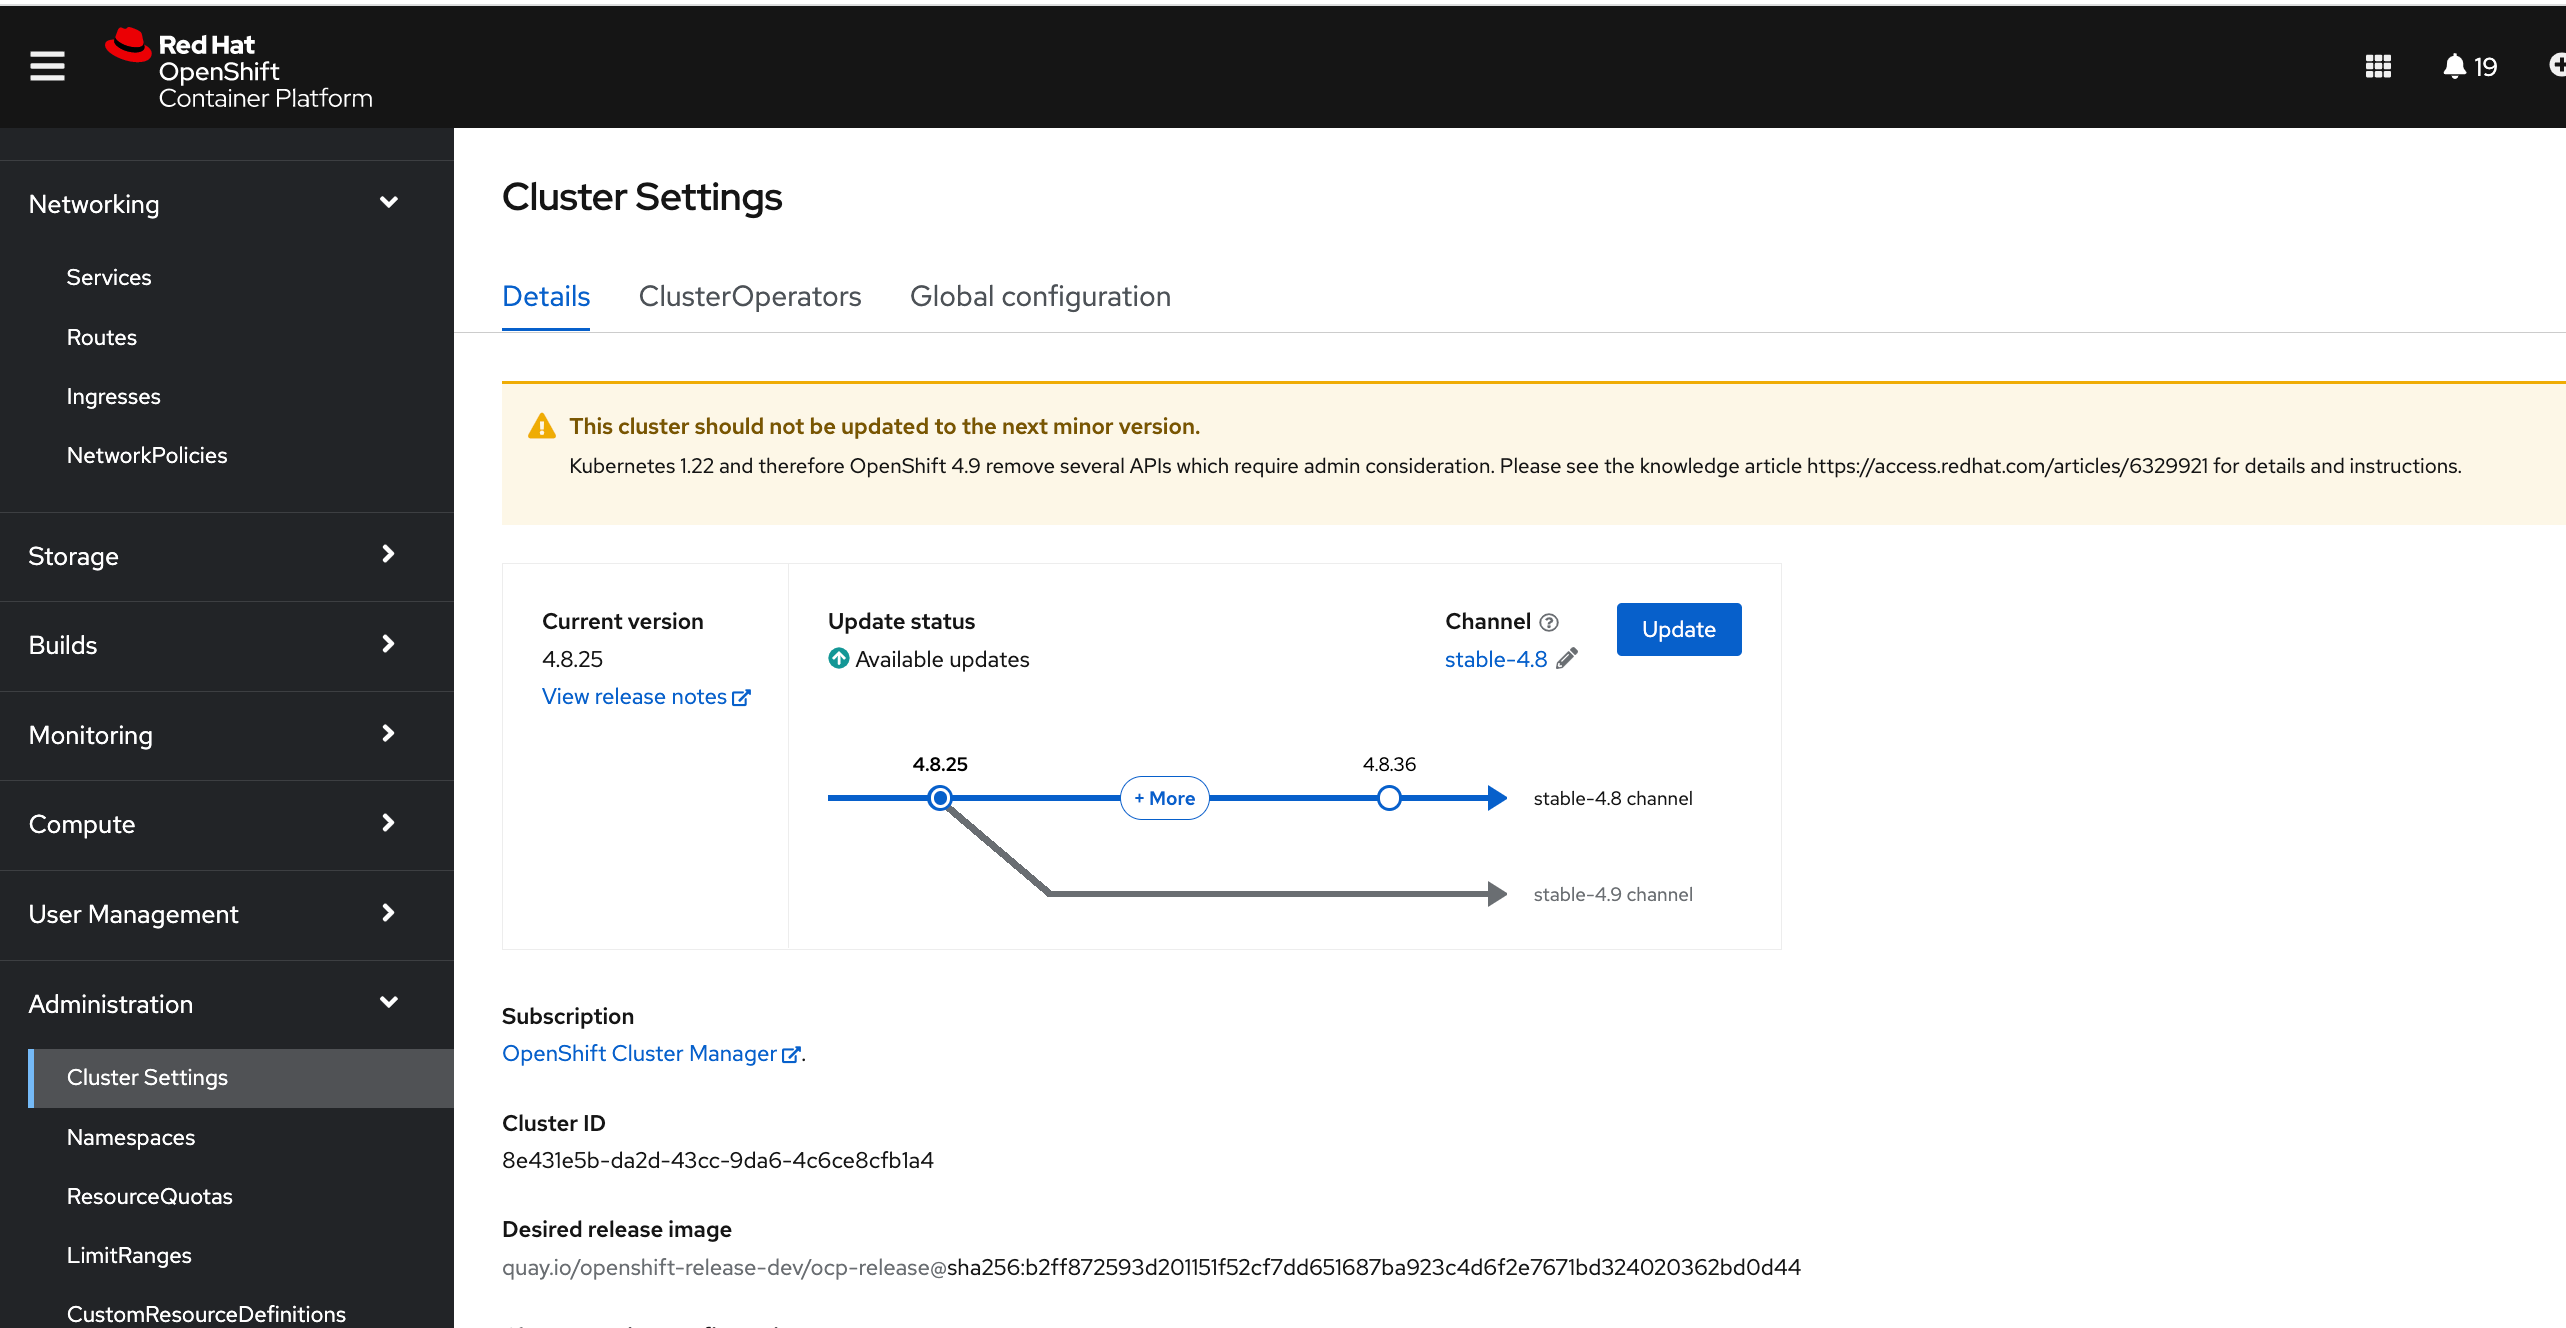
At the demo level, you can go to the Administration console in Administration > Cluster Settings you get something like this:
-
If you want to upgrade version within the same release
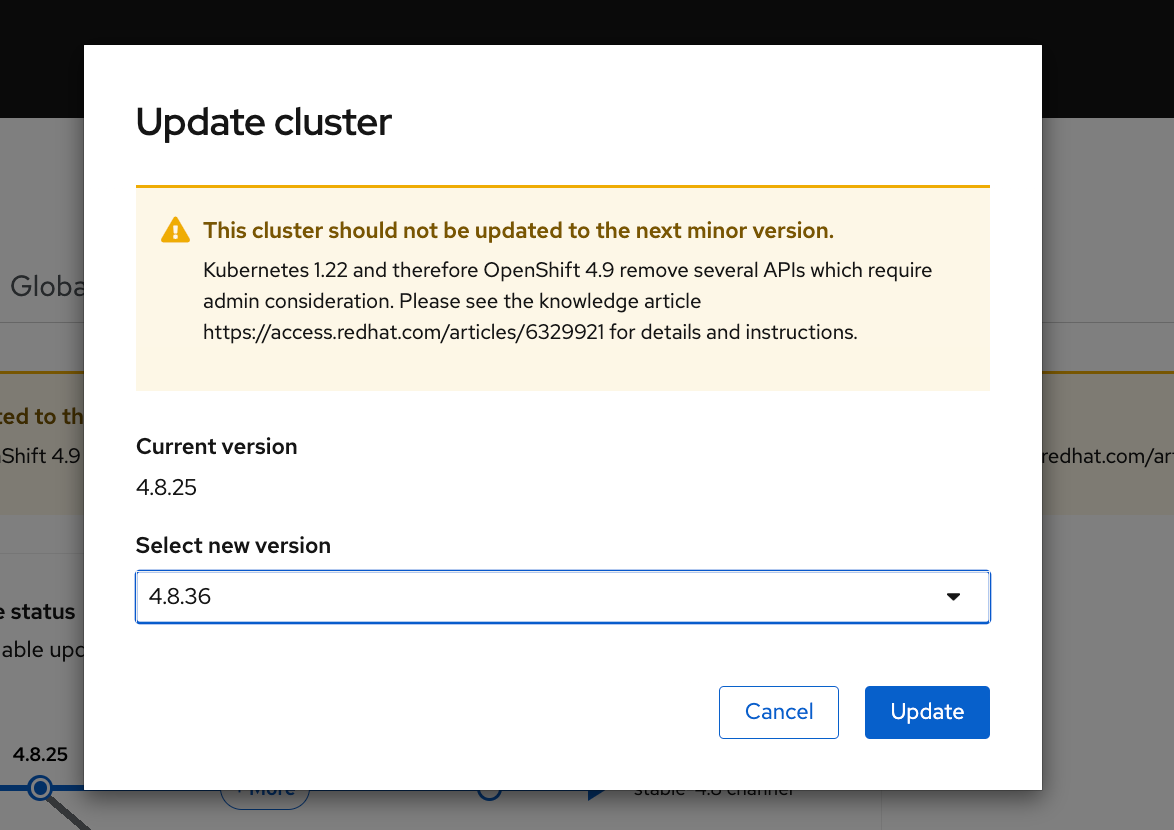
-
Or upgrade release change the Channel version:
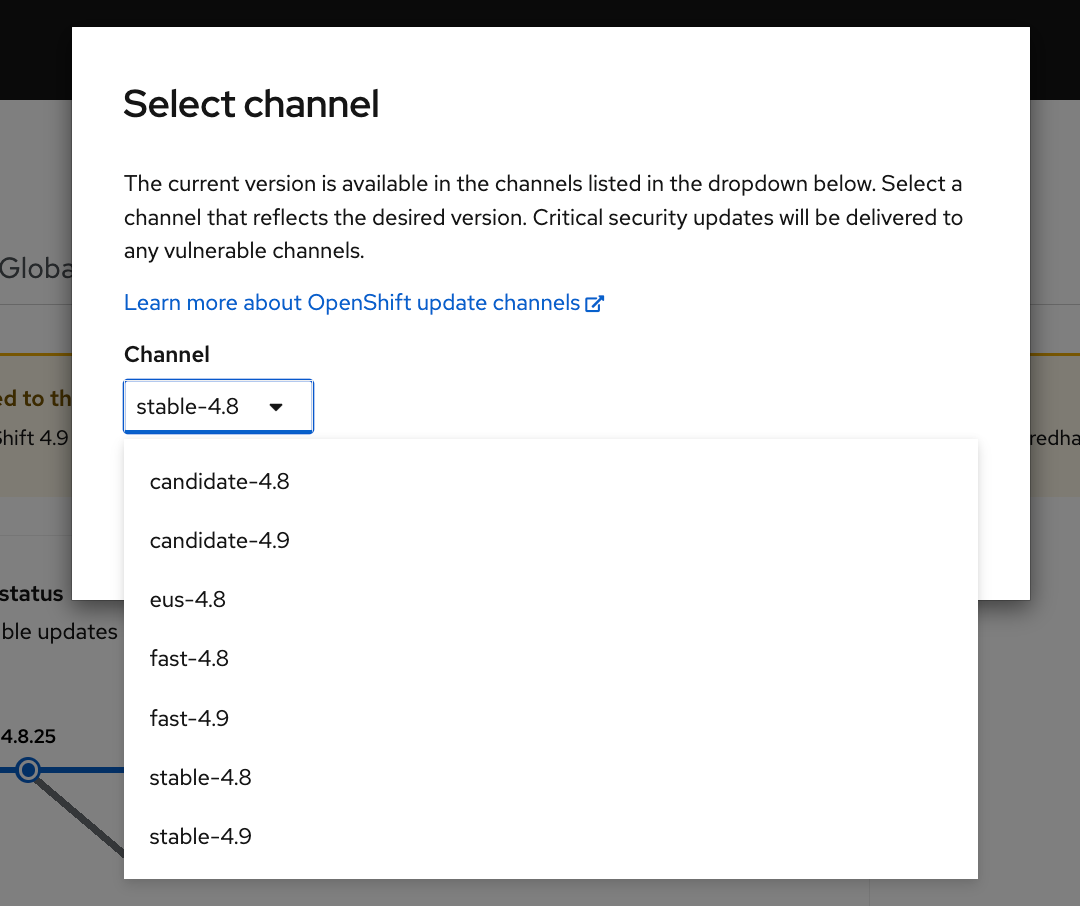
As the operation will take sometime, it is not really demonstrable easily.